SQL DBA
Differences between SQL Server 2012 Enterprise Edition – Server CAL and Per Core Licensing
Problem
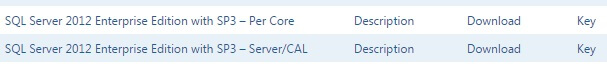
Selecting the right version of SQL Server to install is important to make sure you are getting the correct features that are necessary for your configuration. As an example, in the Volume Licensing Service Center (VLSC) there are two downloadable editions of SQL Server 2012 Enterprise Edition (EE); SQL Server 2012 Enterprise Edition – Server/CAL and SQL Server 2012 Enterprise Edition – Per Core. What are the differences between these two downloads?
Solution
After you have login successfully into the Microsoft VLSC web site, you can see there are two SQL Server 2012 Enterprise Editions on the download page as per the below screen shot.
There are two key differences between SQL Server 2012 Enterprise Edition – Server/CAL vs. Per Core:
- Licensing agreement
- Processor compute capacity
Other than that, both have the same features and functions.
This tip uses SQL Server 2012 EE as an example in the licensing agreement to simplify explanation, but the same differences discussed would be applicable to the Enterprise Edition of SQL Server 2014 and SQL Server 2016.
SQL Server Enterprise Edition Licensing Agreement
An active Software Assurance (SA) benefit allows customers to upgrade their SQL Server deployments to the same corresponding newly released version of SQL Server at no additional cost during their agreement term. For example, if you have an existing SQL Server 2008 R2 EE – Server/CAL software license covered by an active SA agreement when SQL Server 2014 was released you were entitled to upgrade to SQL Server 2014 EE – Server/CAL at no additional cost.
SQL Server 2008 R2 EE – Server/CAL is used as an example here because EE Server licenses have ceased to be available for new agreements. For customers who have purchased SQL Server 2008 R2 EE Server licenses, then SQL Server 2012 EE (or a higher version) – Server/CAL download is applicable in this scenario.
In the Per Core licensing model, whether licensing the physical or virtual machine they should download and deploy SQL Server 2012 EE (or higher version) – Per Core.
The table below describes the version upgrade rights offered under SA for qualified licenses.
| Version upgrade rights for SQL Server 2008 R2 EE | |
|---|---|
| SQL Server 2008 R2 EE Server licenses (ceased to be available) |
SQL Server 2012 EE (or higher version) – Server/CAL ** subject to 20-core limit |
| SQL Server 2008 R2 EE Processor licenses (ceased to be available) |
SQL Server 2012 EE (or higher version) – Per Core |
Processor Compute Capacity
SQL Server 2012 EE – Server/CAL only supports up to 20 physical cores on a physical machine and up to 20 virtual logical processors on a virtual machine. SQL Server 2012 EE – Per Core does not have this limitation and would be able to support up to the operating system maximum.
The table below provides a matrix which summarizes the processor compute capacity that can be used by a single SQL Server EE instance.
| SQL Server 2012 Edition | Physical | Physical hyper-thread enabled | Virtual |
|---|---|---|---|
| SQL Server EE – Server | 20 physical cores | 40 logical processors | 20 logical processors |
| SQL Server EE – Per Core | Operating system maximum | Operating system maximum | Operating system maximum |
SQL Server 2012 EE – Server/CAL Deployment
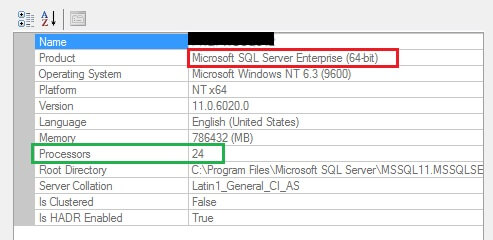
The screen shot below is an installation using SQL Server 2012 EE – Server/CAL download from VLSC on a virtual machine with 24 logical processors. The product name indicates something that we are familiar with seeing – Microsoft SQL Server Enterprise (64-bit).
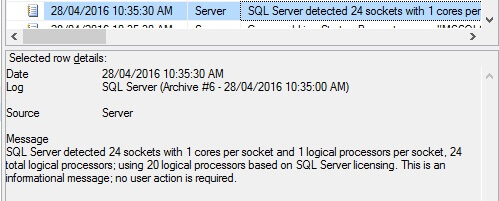
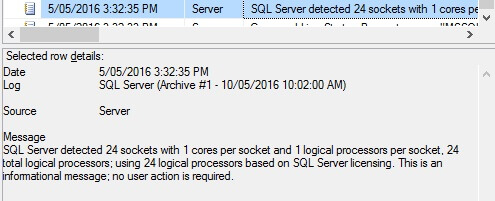
The screen shot below is an informational message taken from the SQL Server Error Log on this virtual machine indicating that only 20 logical processors are in-use out of the 24 logical processors allocated to the virtual machine. This is not an error message, but rather an intended limitation because the EE Server licenses should only run on servers with a total of twenty cores or less.
SQL Server 2012 EE – Per Core Deployment
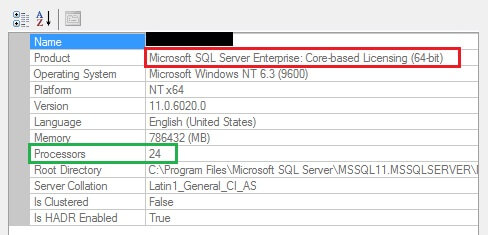
SQL Server 2012 EE – Server/CAL on the same virtual machine above goes through an Edition Upgrade using SQL Server 2012 EE – Per Core download media. This type of upgrade and vice-versa is officially documented and supported by Microsoft.
The product name now will indicate – Microsoft SQL Server Enterprise: Core-based Licensing (64-bit). So unless you see the core-based licensing in the Product name the processor compute capacity is limited to 20 cores.
The SQL Server Error Log will indicate an informational message that all 24 logical processors are in-use for the SQL Server 2012 EE – Per Core installation.
Summary
SA supports a variety of customer upgrade and downgrade scenarios in the licensing agreement. Licensing is a very complicated topic and this tip only covers a couple specific examples. You should check with your organization’s Microsoft licensing representative and deploy the appropriate Enterprise Edition of SQL Server which you are licensed to use.
As noted, this tip uses SQL Server 2012 EE as an example in the licensing agreement to simplify explanation, but the same differences discussed would be applicable to the Enterprise Edition of SQL Server 2014 and SQL Server 2016.
Script to Manage SQL Server Rebuilds and Reorganize for Index Fragmentation
Problem
Indexes are one of the main database objects in SQL Server that massively contribute towards performance. By using the proper indexes, you can avoid fully scanning millions of records in tables in order to find what you are looking for. Instead of scanning the tables, you can traverse the index tree (index seek operation) and find what you are looking for much faster.
Even though indexes are very handy and necessary in performant database designs, they need maintenance. One of the reasons for that is fragmentation. The SQL Server Database Engine automatically maintains indexes whenever insert, update or delete modifications take place. However, over time and especially when heavy data modifications take place, index data becomes scattered in the database and thus fragmented. This fragmentation affects the performance of the index seek process, because these indexes do not have the exact logical ordering with the physical ordering inside the database’s data file(s).
One way to handle this issue is by rebuilding fragmented indexes. If you do this using a Maintenance Plan, you will rebuild every single index in the database instead of rebuilding only the fragmented indexes (this has changed in SQL Server 2016). This tip provides a fully parameterized T-SQL script which identifies only the fragmented indexes in a database or in all databases in a SQL Server instance, and either generates a report with the defragmentation commands for review and controlled execution, or directly reorganizes or rebuilds the fragmented indexes based on Microsoft’s recommendations. The script also supports AlwaysOn AG-enabled SQL Server instances.
Solution
Before presenting the script, let’s first discuss a bit about the process of rebuilding indexes. First of all, never rebuild indexes that do not need to be rebuilt. As per Microsoft’s recommendation, when an index has an average fragmentation percentage (use sys.dm_db_index_physical_stats to get these stats) larger than 5% and smaller or equal to 30% you do not need to rebuild the index. In this case, you just need to reorganize it. When the index has an average fragmentation percentage over 30%, then yes, you need to rebuild it. In more modern SQL Server setups, like for example AlwaysOn Availability Groups, you must make additional checks in your index maintenance scripts. For example you must check if a database is the primary replica or not. If it is the primary replica then you can proceed with the index maintenance.
The T-SQL Script presented in this tip handles all the above. You can run it on clustered SQL Server instances, AlwaysOn Availability Group enabled instances, etc. It has built-in logic that based on Microsoft’s recommendations dynamically generates reorganization or rebuild statements only for the fragmented indexes.
SQL Server Index Rebuild and Reorganize Script
The script uses the following parameters:
@reportOnly (required)
Values:
– 0: The script will reorganize or rebuild the fragmented indexes.
– 1: The script will just output the index reorganization or rebuild commands without running them.
@databaseToCheck (optional)
Values:
– NULL: It will scan all databases with compatibility level SQL Server 2005 (90) or later for fragmented indexes.
– ‘DatabaseName’: It will scan only the given database for fragmented indexes.
@fragmentationThreshold (required)
Description: It maintains only the indexes that have average fragmentation percentage equal or higher from the given value.
Value Range: 5-100
@indexFillFactor (required)
Description: The percentage of the data page to be filled up with index data.
Recommended Value Range: 90-100
@indexStatisticsScanningMode (required)
Description: The scanning mode for index statistics
Available Values: ‘DEFAULT’, NULL, ‘LIMITED’, ‘SAMPLED’, or ‘DETAILED’.
Recommended Value: ‘SAMPLED’
@sortInTempdb (required)
Values:
– ‘ON’: Sorts intermediate index results in TempDB.
– ‘OFF’: Sorts intermediate index results in user database’s log file.
@verboseMode (optional)
Values:
0: It does not output additional information on the index reorganization/rebuild process.
1: It outputs additional information on the index reorganization/rebuild process.
Also, please note the following conditions:
- You must be a SysAdmin in order to execute the script.
- The script supports only SQL Server 2005 or later.
- If you execute this script in a SQL Server 2005 instance or later, any databases with compatibility level 2000 (80) or earlier will be automatically excluded from the index reorganization/rebuild process.
The script is provided below:
----
-- Script that reorganizes or rebuilds all indexes having an average fragmentation
-- percentage above a given threshold. It also works in the case
-- where Availability Groups are enabled as it determines if the
-- relevant databases are the primary replicas.
--
-- This script supports only SQL Server 2005 or later.
-- Also, if you execute this script in a SQL Server 2005 instance
-- or later, any databases with compatibility level 2000 (80) or earlier
-- will be automatically excluded from the index reorganization/rebuild process.
----

--Initial check - You must be SysAdmin
DECLARE @isSysAdmin INT
SET @isSysAdmin=(SELECT IS_SRVROLEMEMBER ('sysadmin'));

--Initial check - You must be using SQL Server 2005 or later
DECLARE @SQLServerVersion INT
SET @SQLServerVersion=(SELECT CAST(LEFT(CAST(SERVERPROPERTY('ProductVersion') AS VARCHAR(50)),CHARINDEX('.',CAST(SERVERPROPERTY('ProductVersion') AS VARCHAR(50)))-1) AS INT));


IF @isSysAdmin=1 AND @SQLServerVersion >= 9
BEGIN

--
-- Variable/parameters Declaration
--
DECLARE @dbname NVARCHAR(128);
DECLARE @ReorganizeOrRebuildCommand NVARCHAR(MAX);
DECLARE @dbid INT;
DECLARE @indexFillFactor VARCHAR(5);
DECLARE @fragmentationThreshold VARCHAR(10);
DECLARE @indexStatisticsScanningMode VARCHAR(20);
DECLARE @verboseMode BIT;
DECLARE @reportOnly BIT;
DECLARE @sortInTempdb VARCHAR(3);
DECLARE @isHadrEnabled BIT;
DECLARE @databaseToCheck VARCHAR(250)
DECLARE @dynamic_command NVARCHAR(1024);
DECLARE @dynamic_command_get_tables NVARCHAR(MAX);

--Initializations - Do not change
SET @databaseToCheck=NULL;
SET @dynamic_command = NULL;
SET @dynamic_command_get_tables = NULL;
SET @isHadrEnabled=0;

SET NOCOUNT ON;

---------------------------------------------------------
--Set Parameter Values: You can change these (optional) -
--Note: The script has default parameters set   -
---------------------------------------------------------
--if set to 1: it will just generate a report with the index reorganization/rebuild statements
--if set to 0: it will reorganize or rebuild the fragmented indexes
SET @reportOnly = 0;

--optional: if not set (NULL), it will scann all databases
--If name is set (i.e. 'testDB') it will just scan the given database
SET @databaseToCheck = NULL;

--maintains only the indexes that have average fragmentation percentage equal or higher from the given value
SET @fragmentationThreshold = 15;

--fill factor - the percentage of the data page to be filled up with index data
SET @indexFillFactor = 90;

--sets the scanning mode for index statistics
--available values: 'DEFAULT', NULL, 'LIMITED', 'SAMPLED', or 'DETAILED'
SET @indexStatisticsScanningMode='SAMPLED';

--if set to ON: sorts intermediate index results in TempDB
--if set to OFF: sorts intermediate index results in user database's log file
SET @sortInTempdb='ON';

--if set to 0: Does not output additional information about the index reorganization/rebuild process
--if set to 0: Outputs additional information about the index reorganization/rebuild process
SET @verboseMode = 0;
------------------------------
--End Parameter Values Setup -
------------------------------

-- check if given database exists and if compatibility level >= SQL 2005 (90)
IF @verboseMode=1
 PRINT 'Checking if database '+@databaseToCheck+' exists and if compatibility level equals or greater 2005 (90)';

 -- if given database does not exist, raise error with severity 20
 -- in order to terminate script's execution
IF @databaseToCheck IS NOT NULL
BEGIN
 DECLARE @checkResult INT
 SET @checkResult=(SELECT COUNT(*) FROM master.sys.databases WHERE [name]=RTRIM(@databaseToCheck));
 IF @checkResult<1
  RAISERROR('Error executing index reorganization/rebuild script: Database does not exist' , 20, 1) WITH LOG;

 DECLARE @checkResult2 INT
 SET @checkResult=(SELECT [compatibility_level] FROM master.sys.databases WHERE [name]=RTRIM(@databaseToCheck));
 IF @checkResult<90
  RAISERROR('Error executing index reorganization/rebuild script: Only databases with SQL Server 2005 or later compatibility level are supported' , 20, 1) WITH LOG;
END

IF @verboseMode=1
 PRINT 'Initial checks completed with no errors.';

-- Temporary table for storing index fragmentation details
IF OBJECT_ID('tempdb..#tmpFragmentedIndexes') IS NULL
BEGIN
CREATE TABLE #tmpFragmentedIndexes
    (
      [dbName] sysname,
      [tableName] sysname,
   [schemaName] sysname,
      [indexName] sysname,
      [databaseID] SMALLINT ,
      [objectID] INT ,
      [indexID] INT ,
      [AvgFragmentationPercentage] FLOAT,
   [reorganizationOrRebuildCommand] NVARCHAR(MAX)
    );
END

-- Initialize temporary table
DELETE FROM #tmpFragmentedIndexes;

-- Validate parameters/set defaults
IF @sortInTempdb NOT IN ('ON','OFF')
SET @sortInTempdb='ON';

-- Check if instance has AlwaysOn AGs enabled
SET @isHadrEnabled=CAST((SELECT ISNULL(SERVERPROPERTY('IsHadrEnabled'),0)) AS BIT);

-- if database not specified scan all databases
IF @databaseToCheck IS NULL
BEGIN
DECLARE dbNames_cursor CURSOR
FOR
    SELECT  s.[name] AS dbName ,
            s.database_id
    FROM    master.sys.databases s
    WHERE   s.state_desc = 'ONLINE'
            AND s.is_read_only != 1
            AND s.[name] NOT IN ( 'master', 'model', 'tempdb' )
   AND s.[compatibility_level]>=90
    ORDER BY s.database_id;
END
ELSE
-- if database specified, scan only that database
BEGIN
DECLARE dbNames_cursor CURSOR
FOR
    SELECT  s.[name] AS dbName ,
            s.database_id
    FROM    master.sys.databases s
    WHERE   s.state_desc = 'ONLINE'
            AND s.is_read_only != 1
   AND s.[name]=RTRIM(@databaseToCheck)
END

-- if Always On Availability Groups are enabled, check for primary databases
-- (thus exclude secondary databases)
IF @isHadrEnabled=1
BEGIN

DEALLOCATE dbNames_cursor;

-- if database not specified scan all databases
IF @databaseToCheck IS NULL
BEGIN
 DECLARE dbNames_cursor CURSOR
 FOR
  SELECT  s.[name] AS dbName ,
    s.database_id
  FROM    master.sys.databases s
    LEFT JOIN master.sys.dm_hadr_availability_replica_states r ON s.replica_id = r.replica_id
  WHERE   s.state_desc = 'ONLINE'
    AND s.is_read_only != 1
    AND UPPER(ISNULL(r.role_desc, 'NonHadrEnabled')) NOT LIKE 'SECONDARY'
    AND s.[name] NOT IN ( 'master', 'model', 'tempdb' )
    AND s.[compatibility_level]>=90
  ORDER BY s.database_id;
END
ELSE
-- if database specified, scan only that database
BEGIN
 DECLARE dbNames_cursor CURSOR
 FOR
  SELECT  s.[name] AS dbName ,
    s.database_id
  FROM    master.sys.databases s
    LEFT JOIN master.sys.dm_hadr_availability_replica_states r ON s.replica_id = r.replica_id
  WHERE   s.state_desc = 'ONLINE'
    AND s.is_read_only != 1
    AND UPPER(ISNULL(r.role_desc, 'NonHadrEnabled')) NOT LIKE 'SECONDARY'
    AND s.[name]=RTRIM(@databaseToCheck);
END
END


--
-- For each database included in the cursor,
-- gather all tables that have indexes with
-- average fragmentation percentage equal or above @fragmentationThreshold
--
OPEN dbNames_cursor;
FETCH NEXT FROM dbNames_cursor INTO @dbname, @dbid;
WHILE @@fetch_status = 0
    BEGIN

 --If verbose mode is enabled, print logs
        IF @verboseMode = 1
            BEGIN
    PRINT ''
                PRINT 'Gathering index fragmentation statistics for database: ['+ @dbname + '] with id: ' + CAST(@dbid AS VARCHAR(10));
            END;

        SET @dynamic_command_get_tables = N'
 USE [' + @dbname+ N'];
 INSERT INTO #tmpFragmentedIndexes (
  [dbName],
  [tableName],
  [schemaName],
  [indexName],
  [databaseID],
  [objectID],
  [indexID],
  [AvgFragmentationPercentage],
  [reorganizationOrRebuildCommand]
  )
  SELECT
     DB_NAME() as [dbName],
     tbl.name as [tableName],
     SCHEMA_NAME (tbl.schema_id) as schemaName,
     idx.Name as [indexName],
     pst.database_id as [databaseID],
     pst.object_id as [objectID],
     pst.index_id as [indexID],
     pst.avg_fragmentation_in_percent as [AvgFragmentationPercentage],
     CASE WHEN pst.avg_fragmentation_in_percent > 30 THEN
     ''ALTER INDEX [''+idx.Name+''] ON [''+DB_NAME()+''].[''+SCHEMA_NAME (tbl.schema_id)+''].[''+tbl.name+''] REBUILD WITH (FILLFACTOR = '+@indexFillFactor+', SORT_IN_TEMPDB = '+@sortInTempdb+', STATISTICS_NORECOMPUTE = OFF);''
     WHEN pst.avg_fragmentation_in_percent > 5 AND pst.avg_fragmentation_in_percent <= 30 THEN
     ''ALTER INDEX [''+idx.Name+''] ON [''+DB_NAME()+''].[''+SCHEMA_NAME (tbl.schema_id)+''].[''+tbl.name+''] REORGANIZE;''
     ELSE
     NULL
     END
  FROM sys.dm_db_index_physical_stats(DB_ID(), NULL, NULL, NULL , '''+@indexStatisticsScanningMode+''') as pst
   INNER JOIN sys.tables as tbl ON pst.object_id = tbl.object_id
   INNER JOIN sys.indexes idx ON pst.object_id = idx.object_id AND pst.index_id = idx.index_id
  WHERE pst.index_id != 0
   AND pst.alloc_unit_type_desc IN ( N''IN_ROW_DATA'', N''ROW_OVERFLOW_DATA'')
   AND pst.avg_fragmentation_in_percent >= '+ @fragmentationThreshold + '';

  -- if verbose  mode is enabled, print logs
  IF @verboseMode=1
   BEGIN
    PRINT 'Index fragmentation statistics script: ';
    PRINT @dynamic_command_get_tables;
  END

  -- gather index fragmentation statistics
        EXEC (@dynamic_command_get_tables);

     -- bring next record from the cursor
        FETCH NEXT FROM dbNames_cursor INTO @dbname, @dbid;
    END;

CLOSE dbNames_cursor;
DEALLOCATE dbNames_cursor;

------------------------------------------------------------

-- if 'report only' mode is enabled
IF @reportOnly=1
BEGIN
 SELECT  dbName ,
            tableName ,
            schemaName ,
            indexName ,
            AvgFragmentationPercentage ,
            reorganizationOrRebuildCommand
 FROM    #tmpFragmentedIndexes
 ORDER BY AvgFragmentationPercentage DESC;
END
ELSE
-- if 'report only' mode is disabled, then execute
-- index reorganize/rebuild statements
BEGIN
 DECLARE reorganizeOrRebuildCommands_cursor CURSOR
 FOR
    SELECT  reorganizationOrRebuildCommand
  FROM #tmpFragmentedIndexes
  WHERE reorganizationOrRebuildCommand IS NOT NULL
  ORDER BY AvgFragmentationPercentage DESC;

 OPEN reorganizeOrRebuildCommands_cursor;
 FETCH NEXT FROM reorganizeOrRebuildCommands_cursor INTO @ReorganizeOrRebuildCommand;
 WHILE @@fetch_status = 0
  BEGIN

   IF @verboseMode = 1
   BEGIN
     PRINT ''
     PRINT 'Executing script:'
     PRINT @ReorganizeOrRebuildCommand
   END

   EXEC (@ReorganizeOrRebuildCommand);
   FETCH NEXT FROM reorganizeOrRebuildCommands_cursor INTO @ReorganizeOrRebuildCommand;
  END;

 CLOSE reorganizeOrRebuildCommands_cursor;
 DEALLOCATE reorganizeOrRebuildCommands_cursor;

 PRINT ''
 PRINT 'All fragmented indexes have been reorganized/rebuilt.'
 PRINT ''
END
END
ELSE
BEGIN
 PRINT '';
 PRINT 'Error: You need to be SysAdmin and use SQL Server 2005 or later in order to use this script.';
 PRINT '';
END
--End of Script
Example Use of SQL Server Index Rebuild and Reorganize Script
Report Only
Let’s see an example of using the script with @reportOnly=1 and with @fragmentationThreshold=15 for the sample database ‘AdventureWorks2014’. These settings were changed and the script was run.
The script generated a report with 39 fragmented indexes.
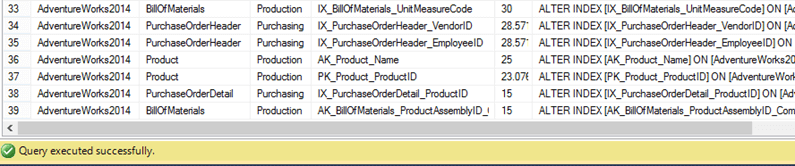
A total of 32 indexes needed to be rebuilt:
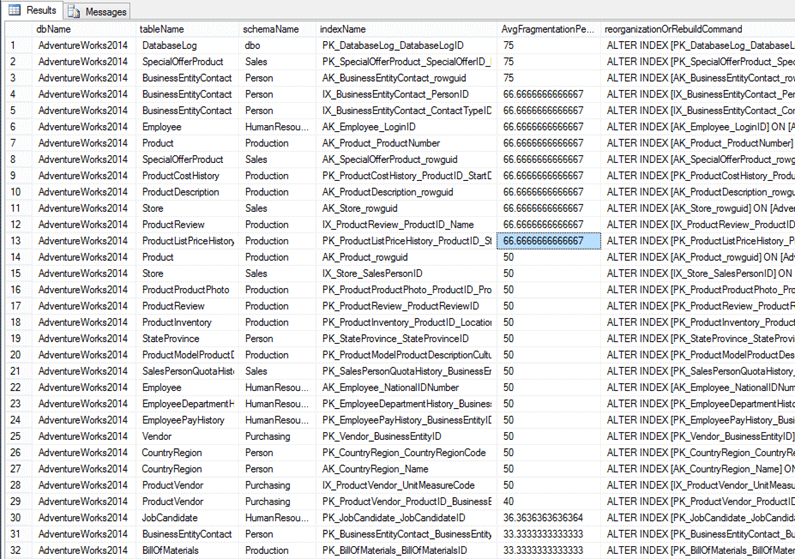
And a total of 7 indexes needed to be reorganized:
Actual Rebuild and Reorganize Indexes
Now let’s run the same example, but this time using the script with @reportOnly=0, @fragmentationThreshold=15 and database is set to ‘AdventureWorks2014’ as before.
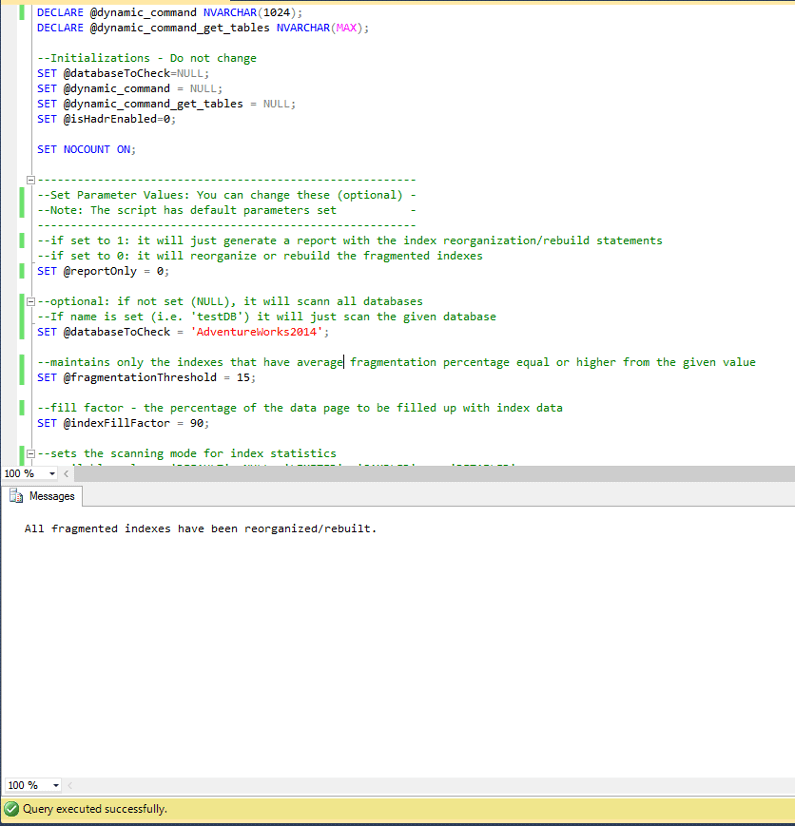
As you can see, all indexes were reorganized / rebuilt.
Summary
The above script is very powerful and can help you maintain your indexes not only in standalone or clustered indexes of SQL Server, but also in AlwaysOn-Enabled instances that use Availability Groups.
Reorganizing and rebuilding indexes is not always the “magic” solution. It can sure help performance, but you need to maintain the health of your SQL Server instances in every aspect. You need to keep statistics updated, take into consideration how the storage system you use is organized and operates, set the proper parameters for your database settings and much more.
Nevertheless, index reorganization and specially rebuilds is one of the top choices for many DBAs as it is a fast way to fix (even temporarily sometimes) performance issues. This tip can help you through this process by simplifying the entire procedure.
Downgrade from SQL Server Enterprise Edition to Standard Edition
Problem
I have a SQL Server that was installed as Enterprise Edition. I don’t need the Enterprise features and I don’t want to pay for the licensing. What is the best way to downgrade to Standard Edition?
Solution
I’ve came across a lot of SQL Server’s in my career that were installed using the Enterprise Edition and never utilized the Enterprise features. Downgrading to a lower edition cannot be done in place. This tip will describe the steps needed to downgrade.
Create Database Backups
As always, before doing anything drastic (or non-drastic), BACKUP all the databases (system and user)! Also, if you have a development environment, please test on it first.
Check for Enterprise features
After backing up the databases run the following query on each database:
This DMV will tell you whether or not the database is utilizing any of the Enterprise features. You can find more information regarding this DMV from this tip.
Check Version and Build Number
Because you never know when an install may fail, check the version and build number of the current SQL Server. After the downgrade, you will need to bring the new SQL Server back to the patch level. You can view this information by executing the following command:
Save the results to a text editor.
Decision…
There are two different directions we can go from here.
- We can do the traditional uninstall Enterprise, install Standard, patch, restore databases
- Or we can do what I call “The Jonathan Kehayias” approach. (I saw this method awhile back from a forum post by Jonathan):
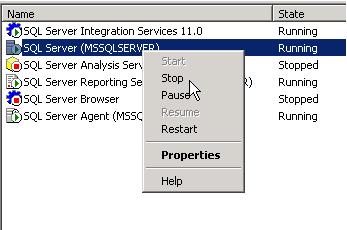
Copy System Databases
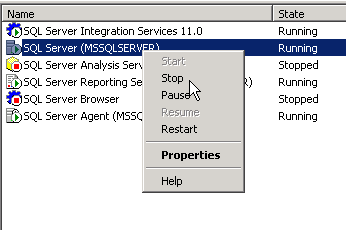
Shutdown the SQL Server service and copy the master, model and msdb database files (.mdf and .ldf) to another location. We will need these later:
Uninstall SQL Server
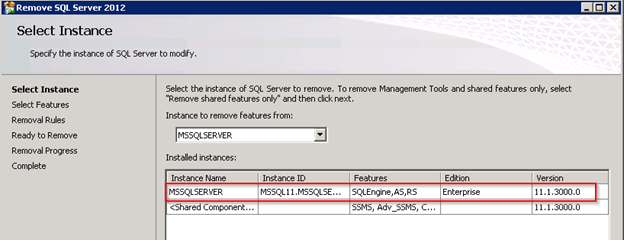
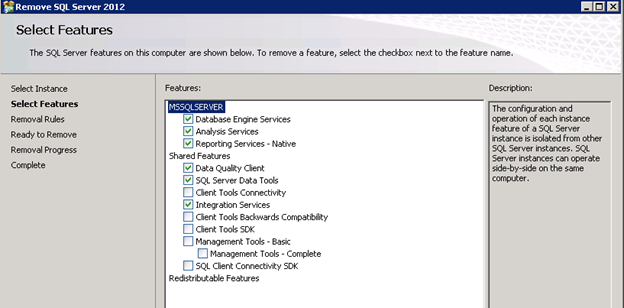
Uninstall SQL Server from Control Panel:
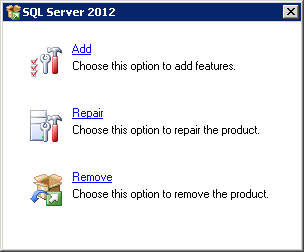
You only need to uninstall the Instance (includes SSIS, SSAS, SSRS, SSDT). There is no need to uninstall the Shared Components (SSMS, Client Tools, and Connectivity).
Reboot
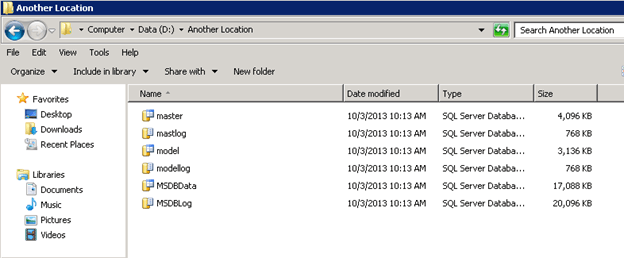
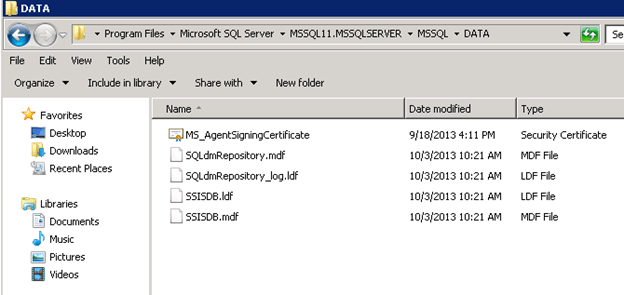
Reboot the server. After rebooting, browse to the location of the data files and you will notice that the user databases weren’t removed with the uninstall, but the system databases were. This is why we copied them in the step above:
Install New SQL Server Edition
Enterprise Edition should be completely removed from the system now. Insert/Mount the media for SQL Server Standard and install. The install should be pretty straight forward. To make things easier in the end, make sure the name of the instance remains the same and the Data Directories point to the correct location.
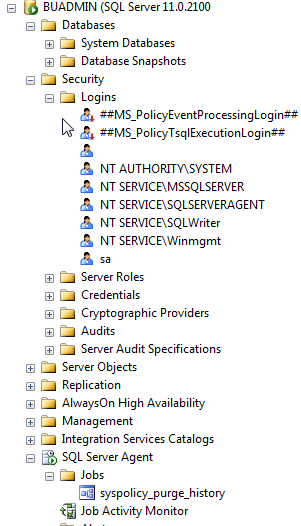
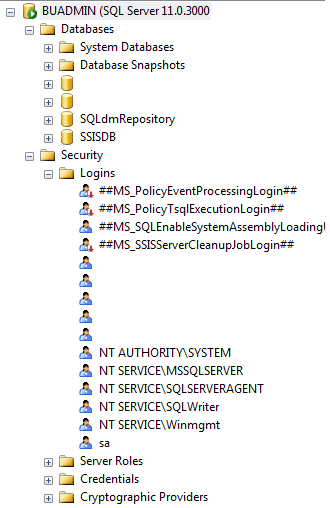
Once SQL Server is finished installing, open SQL Management Studio and connect to the newly installed instance.
If you expand Databases, Security/Logins, SQL Server Agent/Jobs, etc. you will see it looks like a fresh copy of SQL Server.
Also, if you run the following command you will see that the version has changed to Standard Edition:

Install SQL Server Patches
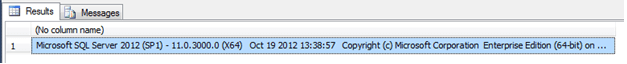
In this example, you will also notice that the build number has changed from 11.0.3000.0 to 11.0.2100.60 so I will need to install the correct patches to bring this server back to 11.0.3000.0.
(11.0.3000.0 is SQL Server 2012 SP1)
Download the correct patches and install on the server before doing anything else.
Once the patches are installed check the server to make sure it’s at the same build number as it was before.
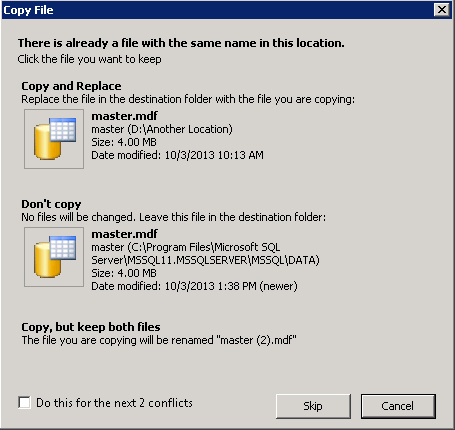
Copy System Databases
Shutdown the SQL Server service and copy the master, model and msdb database files (.mdf and .ldf) from the location you saved them in to the new location for the new install.
Start SQL Server
After copying the system files to the new location you can start SQL Server again:
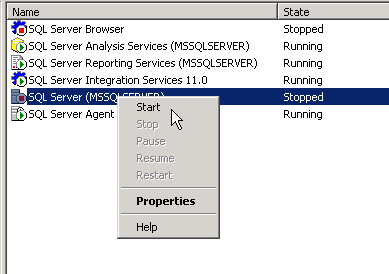
Once SQL Server comes back online, you should see all the databases, logins, jobs, etc. back to normal:
How to Fix a Corrupt MSDB SQL Server Database
Problem
You have to fix a corrupt SQL Server msdb database and to make things worse, there is no recent database backup. If you run setup with the option REBUILDDATABASE you will also rebuild the master database and lose all the logins unless you backup and restore the master database. Is this the best option? Keep reading and you will see that there is another way to rebuild the msdb database without compromising the master database.
Solution
Dealing with corruption of system databases is one of the most feared situations for SQL Server DBAs. Luckily, there are a few different options to fix the corrupt SQL Server instance to get back up and running. You can get a list of those methods in John Grover’s tip on How to recover a suspect msdb database in SQL Server. The last method John proposes in his tip is to “Use a SQL Server Template MSDB Database”, but this option has two paths depending on what SQL Server version you are working with. If you have an instance of SQL Server 2008 or later, you can copy the database template in the Binn\Templates subfolder of the instance root directory. But if you are working with a previous version then you have to use the method that I will expose in this tip.
Most of the articles about msdb database corruption refer to a physically corrupted database, but what if instead you have logical corruption? I mean, for example if someone accidentally or deliberately modified some of the stored procedures of the msdb database. In that case, using the template msdb database won’t be the best approach because you will lose all the job definitions, Integration Services Packages stored in msdb, etc.
The possible solution to the previous scenario relies on the Install subfolder of SQL Server instance root directory, which is usually C:\Program Files\Microsoft SQL Server\MSSQL13.MSSQLSERVER\MSSQL\Install. There is a file in that folder named instmsdb.sql which is the msdb creation script. Let’s see how we can use it.
Option 1 – Rebuild a Corrupt msdb SQL Server Database
This procedure is quite straightforward. It consists of starting the SQL Server instance with trace flag 3608. This trace flag prevents the instance from automatically recovering any database except master. But databases will be started and recovered when accessed, so if we want to rebuild the msdb database it is a wise to avoid connections to that database.
The first step is to stop the SQL Server Instance and all the dependent services like Integration Services, Analysis Services, Reporting Services and any other application that use SQL Server. You can use any administrative tool for that purpose like the Services Manager. The screen shot below shows a command window with the commands (i.e. NET STOP) I have used to stop the SQL Server services.
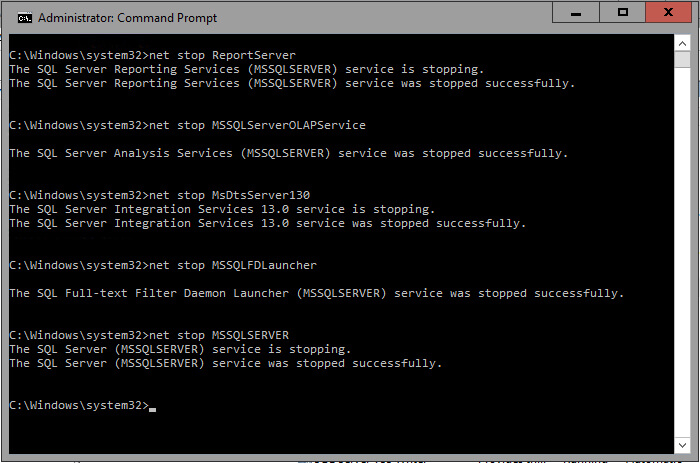
Now we are going to start the SQL Server service with the following parameters.
net start MSSQLSERVER /T3608 /f /m"SQLCMD"
The /T3608 parameter enables the trace flag 3608 to prevent the msdb database from starting up. Notice that the “T” letter is uppercase; most of the startup flags are specified with an uppercase “T”, there are some others that use a lowercase “t”, but are usually used by Microsoft technical support only. The “/f” parameter is to start SQL Server service with its minimal configuration and in single user mode; we want to be the only ones to access the instance. The last parameter /m”SQLCMD” tells the instance to only accept connections for an application that identifies as SQLCMD. That’s to avoid other applications to connect to the instance.
After the instance starts up, we open a Command window and change the folder to the install folder of the instance root directory and from there we connect to it with the SQLCMD application and detach the msdb database.
SQLCMD -E -S -Q"EXEC sp_detach_db msdb"
The –E parameter is used to establish a trusted connection, you can use a SQL Server login like sa if you want to. The –Q parameter executes the quoted commands and exits.
Now you can stop the instance and start it up again normally, I mean without any special consideration.
The next step is to rename the msdb database files; otherwise the next step will fail. By default these files are in the DATA sub-folder for the SQL Server instance.
If you try to connect to the instance using SQL Server Management Studio you will get an error message, but you can still use SQL Server Management Studio by selecting New\Database Engine Query, like on the next image.
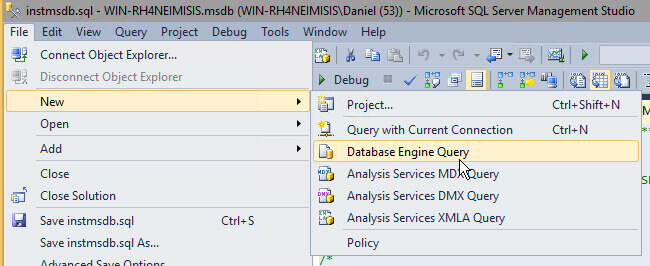
Now to recreate the msdb database you can use the next SQLCMD command.
SQLCMD -E -S -iinstmsdb.sql –ologfile.txt
The “-iinstmsdb.sql” parameter instructs SQLCMD to execute the instmsdb.sql script, of course you have to be in the same folder as the script. The “–ologfile.txt” option will save the output to a file named logfile.txt in the same folder.
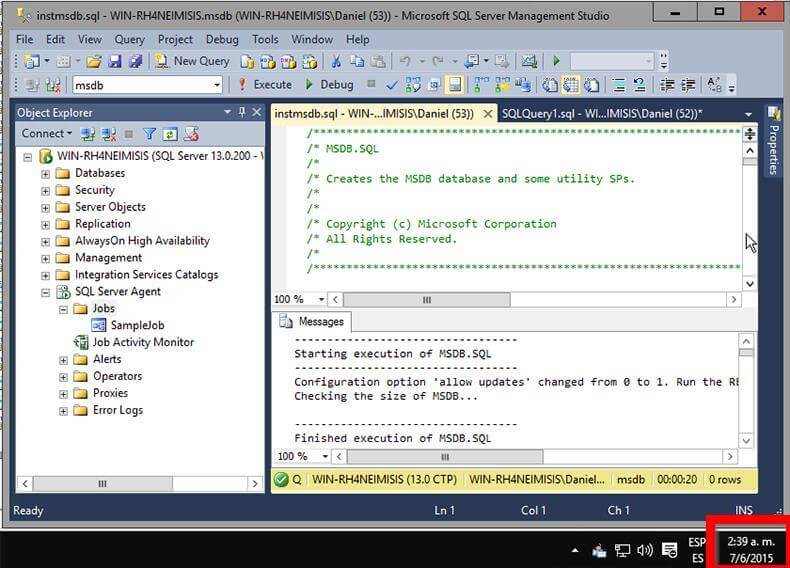
Also you can execute this script by dragging the instmsdb.sql file into SQL Server Management Studio. The next image is a screen capture showing the execution.
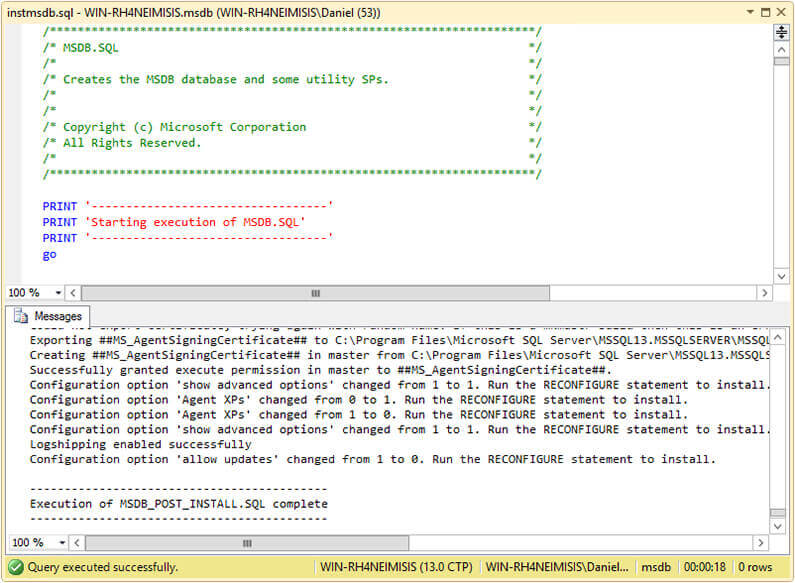
Option 2 – Recover Stored Procedures in the SQL Server msdb Database
If your msdb database has altered stored procedure and you want to get them back to the original version, you can get the original code from the instmsdb.sql file. I tested that if you run the instmsdb.sql script it won’t drop and recreate the system tables in msdb if they exist, but it will drop and recreate the stored procedures. The next script was copied from instmsdb.sql file and intends to create the sysjobs table. Notice that the CREATE TABLE statement is inside an IF block that is executed if the sysjobs table doesn’t exist, so it doesn’t try to recreate the table.
/**************************************************************/
/* SYSJOBS                                                    */
/**************************************************************/

IF (NOT EXISTS (SELECT *
                FROM msdb.dbo.sysobjects
                WHERE (name = N'sysjobs')
                  AND (type = 'U')))
BEGIN
  PRINT ''
  PRINT 'Creating table sysjobs...'

  CREATE TABLE sysjobs
  (
  job_id                     UNIQUEIDENTIFIER NOT NULL,
  originating_server_id      INT              NOT NULL, -- REFERENCE enforced by trig_sysjobs_insert_update
  name                       sysname          NOT NULL,
  enabled                    TINYINT          NOT NULL,
  description                NVARCHAR(512)    NULL,
  start_step_id              INT              NOT NULL,
  category_id                INT              NOT NULL,
  owner_sid                  VARBINARY(85)    NOT NULL,
  notify_level_eventlog      INT              NOT NULL,
  notify_level_email         INT              NOT NULL,
  notify_level_netsend       INT              NOT NULL,
  notify_level_page          INT              NOT NULL,
  notify_email_operator_id   INT              NOT NULL,
  notify_netsend_operator_id INT              NOT NULL,
  notify_page_operator_id    INT              NOT NULL,
  delete_level               INT              NOT NULL,
  date_created               DATETIME         NOT NULL,
  date_modified              DATETIME         NOT NULL,
  version_number             INT              NOT NULL
  )

  CREATE UNIQUE CLUSTERED INDEX clust ON sysjobs(job_id)
  CREATE NONCLUSTERED     INDEX nc1   ON sysjobs(name) -- NOTE: This is deliberately non-unique
  CREATE NONCLUSTERED     INDEX nc3   ON sysjobs(category_id)
  CREATE NONCLUSTERED     INDEX nc4   ON sysjobs(owner_sid)
END
go
In contraposition, the next script also extracted from instmsdb.sql script creates the sp_agent_start_job stored procedure. Notice that before the CREATE PROCEDURE there is an IF block that drops the sp_agent_start_job stored procedure if it exists.
PRINT ''
PRINT 'Creating procedure sp_agent_start_job...'
IF (NOT OBJECT_ID(N'dbo.sp_agent_start_job', 'P') IS NULL)
  DROP PROCEDURE dbo.sp_agent_start_job
GO

CREATE PROCEDURE dbo.sp_agent_start_job
  @job_id      UNIQUEIDENTIFIER
AS
BEGIN
    DECLARE @retval INT

    EXEC @retval = sys.sp_sqlagent_start_job @job_id

    RETURN(@retval) -- 0 means success
END
GO
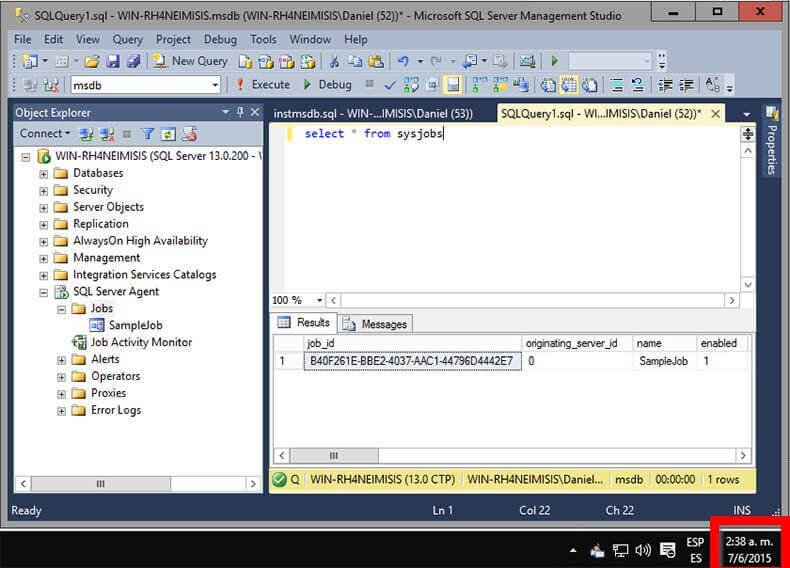
The best part of this fix is that you don’t have to stop the instance and start it with a trace flag in order to execute the instmsdb.sql script. The next three images are screen captures that I took showing the contents of the sysjobs table before executing instmsdb.sql script, the script execution and the contents of the sysjobs table after executing instmsdb.sql script.
Here we can see that there is one job called SampleJob.
In the next screen shot we see the execution of instmsdb.sql.
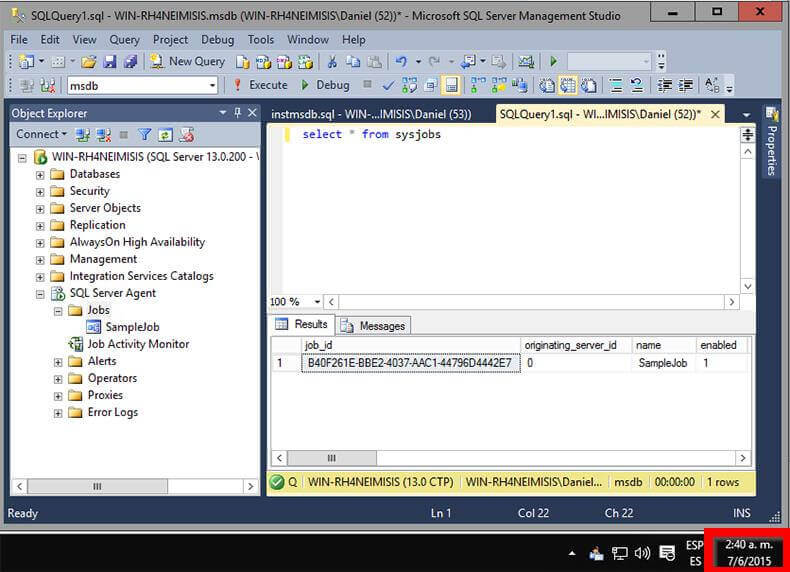
In this final screenshot after instmsdb.sql has been run, we can see that job SampleJob still exists. So all of the data stays intact after running instmsdb.sql against an existing msdb database.
SQL Server Backup Plan
Problem
In a previous tip we discussed 10 items that should be addressed to manage your SQL Server environment. These items included; backups, security, disaster recovery, etc… The first item on the list was to address and implement a sound backup strategy. This is probably one of the easiest things to take care of, but often the wrong options are selected or the wrong or no backup plan is put in place. This tip will address some of the items you should consider when putting your backup process in place.
Solution
The following checklist is a list of items that you should consider when implementing your backup strategy.
| # | Item | Steps |
|---|---|---|
| 1 | Determine What is Needed | Before you begin implementing your backup strategy you need to better understand what you are trying to protect, how much data you need to recover and also whether the data can be recreated easily or not.To get started you need to ask yourself a few questions such as the following:
Based on the answers to these questions you can determine the proper recovery model for your database as well as the proper backup types and backup schedule. |
| 2 | Recovery Model | Based on the answers to the questions in item #1 you can determine the recovery model for your database.
If your answers include Full for any of these questions you should use the Full recovery model. The only difference would be the answer to the last question where you could use Bulk-Logged instead of Full. Note: it is also possible to change your recovery model based on different processing, but you need to ensure your backup process follows any of these changes so you do not potentially loosed important data. |
| 3 | Select Backup Types | SQL Server offers many different types of backups such as the following:
Based on the recovery model you selected you should follow a plan such as the following:
In addition to doing the above, you can also introduce Differential backups in between your Full backups. This is helpful if you do a lot of transaction log backups during the day, so that when you need to restore you can just restore the full backup, the latest differential backup and any transaction log backups after the differential backup. Other options include doing file or filegroup backups for very large databases. |
| 4 | Backup Schedule | The next thing you need to decide is when to schedule your backups. The most intense backup is the full backup since it needs to read the entire database and write out the entire database. Since this activity is disk I/O intensive the best time to do this is at low peak times, therefore most people run full backups during off hours.Here is a sample schedule, again this would be based on what you determined to do in step 3:
|
| 5 | Backup Process | SQL Server offers many built in options to backup your database such as:
In addition to these items there are also several third party tools that allow you to backup your databases. These tools offer some additional options such as writing directly to tape, encryption, compression, etc… The first step is using the one of the built-in options, but these third party tools are great enhancements to the process. |
| 6 | Document | As with all administration activities you should document your backup procedures and the criteria you will use to determine the recovery model as well as the backup types and backup schedule. It is much easier to have a defined plan, so when a new database is created you can just follow the steps that have been outlined instead of having to figure this out each time a new database is introduced. |
| 7 | Backup to Disk | The fastest way to do SQL Server backups is disk to disk. I guess doing the backup to memory would be faster, but this doesn’t give you a permanent copy that can be restored or archived, plus the option doesn’t really exist. There are a lot of backup tools that allow you to go directly to tape, but it is better to have the latest backup on disk so the restore process is faster instead of having to pull the file from tape. |
| 8 | Archive to Tape | Once the backup has been created on disk you should then archive to tape for long term storage. These archive copies are not used all that often, but they do come in handy when you are doing some research or an audit and you need to get the database back to the state it was at some point in the past. |
| 9 | Backup to Different Drives | As mentioned above the backup process is a disk I/O intensive activity. Therefore you should try to separate your disk reads from your disk writes for faster I/O throughput. In addition, it is better to have the backups on a physically separate disk therefore if one of the disks dies you don’t loose both your data file and backup file. |
| 10 | Secure Backup Files | In a previous tip we talked about how native SQL Server backups are written in plain text and can be opened with a text editor and therefore the data could be comprised. Based on this you need to ensure that your backup files are written to a secure location where only the people that need to have access to the files have access. Also, this ensures that the files are not tampered with or accidentally deleted and therefore unavailable when you need them. |
| 11 | Encrypt or Password Protect Backup Files | To take the security to the next level you can use passwords on the backups, so they can not be restored without the password. In addition, you can encrypt your backup files so they can not be compromised as mentioned in item #10. This encryption can be done using third party backup tools. |
| 12 | Compress Backup Files | As databases continue to get larger and larger the need for backup compression becomes a necessity. The native SQL Server backup process does not compress any of the data and therefore your backup files are almost as large as your data files. With third party backups tools you have the ability to compress your backups by up to 90%. In addition, since so much less data is written out to create the backup file you can also see reduction in the time it takes to run the backup by up to 50%. |
| 13 | How Much to Keep on Disk | Another question you need to think about is how many backups to keep on disk. In most cases if you need to do a restore you are going to restore the latest backups. Based on this you could probably get away with just keeping the last days worth of backups on disk assuming that you are then archiving these backups to tape. To be safe you can keep two days worth of files on disk, but a lot of this depends on how large your backups are and also how much disk space you have. Going beyond two days is probably overkill, but there are always exceptions to the rule. |
| 14 | Online Backups | In addition to doing backups to your local disks there are several companies that offer online backups via the internet. Instead of you have to manage your backup files locally these services allow you to backup your databases via the internet and therefore you have an external copy stored outside of your companies network. |
| 15 | Run Restore Verifyonly | After running your backups it is a good idea to use the RESTORE VERIFYONLY option to ensure that the backup that was just created is readable. This doesn’t necessarily mean the restore will work without issue, but it does give you another level of comfort that SQL Server can at least read the backup file. |
| 16 | Offsite Storage | After your backups have been archived to tape the next step is to store these tape copies offsite. There are several companies that provide offsite tape storage. I have also seen people take home the tapes with them, so they are not left onsite in case there is some kind of disaster, such as a fire, that could wipe out all of your data. If you can not afford offsite storage you could also consider Online Backups mentioned in item #14. |
SQL Server Performance Tuning and Monitoring Tutorial
Overview
SQL Server is a great platform to get your database application up and running fast. The graphical interface of SQL Server Management Studio allows you to create tables, insert data, develop stored procedures, etc… in no time at all. Initially your application runs great in your production, test and development environments, but as use of the application increases and the size of your database increases you may start to notice some performance degradation or worse yet, user complaints.
This is where performance monitoring and tuning come into play. Usually the first signs of performance issues surface from user complaints. A screen that used to load immediately now takes several seconds. Or a report that used to take a few minutes to run now takes an hour. As I mentioned these issues usually arise from user complaints, but with a few steps and techniques you can monitor these issues and tune accordingly, so that your database applications are always running at peak performance.
In this tutorial we will cover some of the common issues with performance such as:
- deadlocks
- blocking
- missing and unused indexes
- I/O bottlenecks
- poor query plans
- statistics
- wait stats
- fragmentation
We will look at basic techinques all DBAs and Developers should be aware of to make sure their database applications are performing at peak performance.
Performance Related Tools
Overview
In order to monitor and improve performance for your SQL Server environment you need to know what tools are available and how to use each of these tools.
In this section we will look at the following tools to give you an introduction as to what they are used for an how you can use them to collect performance related data.
- Dynamic Management Views (DMVs) and System Catalog Views
- Profiler and Server Side Traces
- Windows Performance Monitor
- Built in performance reports in SSMS
- Query Plans
- Database Tuning Advisor
Dynamic Management Views
Overview
With the introduction of SQL Server 2005, Microsoft introduced Dynamic Management Views (DMVs) which allow you to get better insight into what is happening in SQL Server. Without these new tools a lot of the information was unavailable or very difficult to obtain.
DMVs are a great tool to help troubleshoot performance related issues and once you understand their power they will become a staple for your Database Administration.
Explanation
The DMVs were introduced in SQL 2005 and with each new release, Microsoft has been adding additional DMVs to help troubleshoot issues. DMVs actually come in two flavors DMVs (dynamic management views) and DMFs (dynamic management functions) and are sometimes classified as DMOs (dynamic management objects). The DMVs act just like any other view where you can select data from them and the DMFs require values to be passed to the function just like any other function.
The DMVs are broken down into the following categories:
- Change Data Capture Related Dynamic Management Views
- Change Tracking Related Dynamic Management Views
- Common Language Runtime Related Dynamic Management Views
- Database Mirroring Related Dynamic Management Views
- Database Related Dynamic Management Views
- Execution Related Dynamic Management Views and Functions
- Extended Events Dynamic Management Views
- Full-Text Search Related Dynamic Management Views
- Filestream-Related Dynamic Management Views (Transact-SQL)
- I/O Related Dynamic Management Views and Functions
- Index Related Dynamic Management Views and Functions
- Object Related Dynamic Management Views and Functions
- Query Notifications Related Dynamic Management Views
- Replication Related Dynamic Management Views
- Resource Governor Dynamic Management Views
- Service Broker Related Dynamic Management Views
- SQL Server Operating System Related Dynamic Management Views
- Transaction Related Dynamic Management Views and Functions
- Security Related Dynamic Management Views
Here are some of the more useful DMVs that you should familiarize yourself with:
- sys.dm_exec_cached_plans – Cached query plans available to SQL Server
- sys.dm_exec_sessions – Sessions in SQL Server
- sys.dm_exec_connections – Connections to SQL Server
- sys.dm_db_index_usage_stats – Seeks, scans, lookups per index
- sys.dm_io_virtual_file_stats – IO statistics for databases and log files
- sys.dm_tran_active_transactions – Transaction state for an instance of SQL Server
- sys.dm_exec_sql_text – Returns TSQL code
- sys.dm_exec_query_plan – Returns query plan
- sys.dm_os_wait_stats – Returns information what resources SQL is waiting on
- sys.dm_os_performance_counters – Returns performance monitor counters related to SQL Server
Profiler and Server Side Traces
Overview
SQL Server provides a great tool that allows you to see what statements are running on your SQL Server as well as collecting metrics such as duration, number of reads, number of writes, the machine that ran the query, etc… this tool is known as Profiler.
Profiler is a GUI based tool that runs a SQL Server trace to capture the metrics listed above as well additional data. This data can then be used to determine where your SQL Server performance issues are related to your TSQL code. Running a trace without using Profiler is known as a Server Side Trace. You can create and start the trace using TSQL commands instead of having to use the GUI.
Explanation
Most people begin using Profiler to run a trace, because the GUI is pretty easy to get a trace setup and running. Once you understand the advantages of using a server side trace you will begin to use these more frequently unless you are troubleshooting an issue that is occurring at that exact time.
Profiler
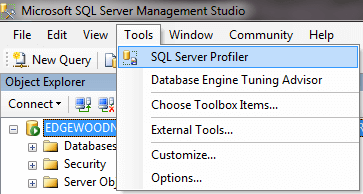
The Profiler tool can be launched in one of these ways:
- In SSMS, select Tools > SQL Server Profiler from the menu
- You can also launch Profiler from the Windows menu
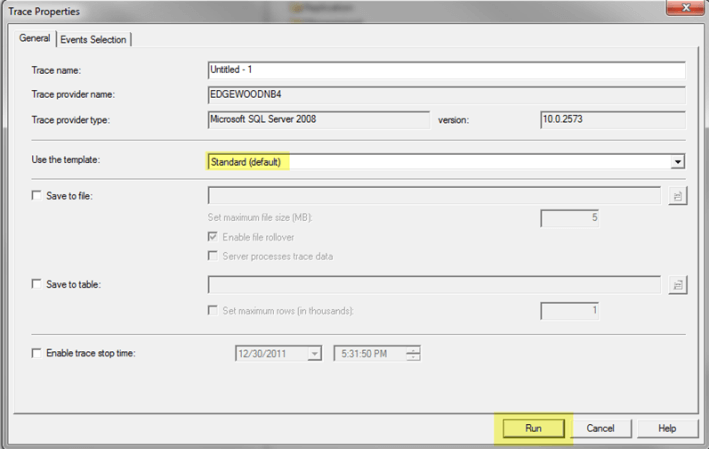
Once you have Profiler launched you need to:
- Connect to the SQL Server instance you want to trace
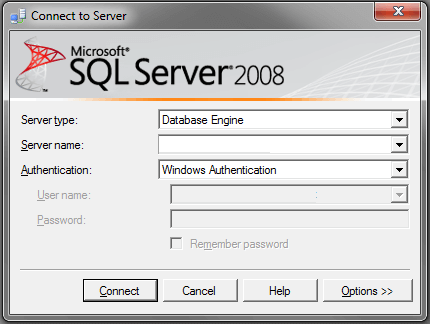
- A Trace Properties window will open and you can click Run to start the trace with the default settings
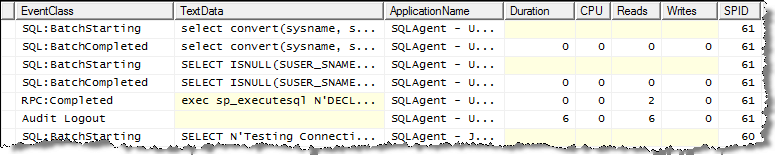
Here is an example of data that is collected:
Selecting Events, Columns and Filters
Ideally you want to select only the Events you want to capture along with setting Filters to minimize the amout of data that is returned. If you just use the standard settings you usually end up with too much information and it is hard to determine what is going on.
Under the Events Selection tab you can select events, columns and set filters as shown below.
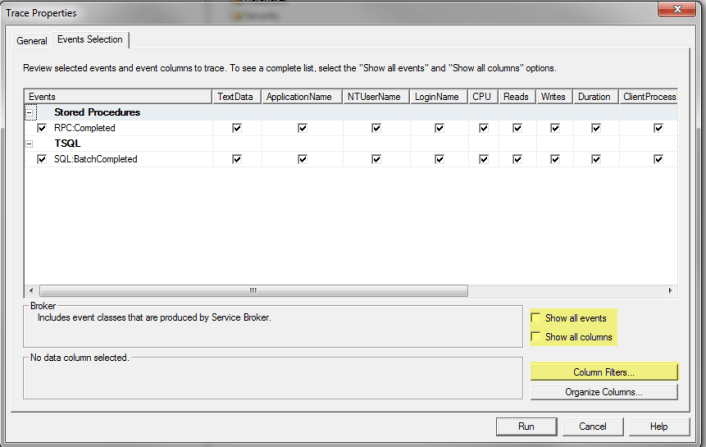
Events
A good starting place is to capture just these two events. These will show you all completed batches and metrics related to the batch. A batch is basically a set of work, like a stored procedure, that contains mulieple statements.
- Stored Procedures – RPC:Completed
- TSQL – SQL:BatchCompleted
Columns
As far as columns go just select all columns and once you see the data that is captured you can reduce the amount of columns you are capturing.
Filters
Filters allow you to further define what is captured. To set filters click on Column Filters. So if you only want to capture data for a specific process you can filter on SPID as an example. Another good starting point is to filter on Duration. I like to set the value to 500 to only show statements that take 500ms or longer. Again this is just a starting point.
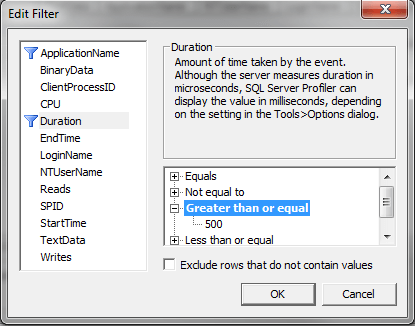
Once you have the settings you want you can run the trace.
Reading the Output
After you have collected the output you can see which statements are returned based on the events and filters that you have set. If you start with the two events above you can begin to take a look at the statements that have the longest duration and these are the statements that you should begin trying to tune to improve performance.
Performance Monitor
Overview
Windows Performance Monitor or PerfMon is another great tool to capture metrics for your entire server. So far we discussed DMVs and Profiler which are great tools for finding out what is occurring within your SQL Server instance, but sometimes there are issues outside of SQL Server that may be causing performance issues. In this section we will take a look at PerfMon and how this tool can be used.
Explanation
The Performance Monitor tool allows you to capture and graph many aspects for the Windows server. There are counters for .NET, Disks, Memory, Processors, Network, etc… as well several counters related to each instance of SQL Server on the box. If you have multiple instances running on one server, the counters are available for each instance so you can see what is occurring at the instance level.
Launching Performance Monitor
You can launch Performance Monitor a few different ways.
Start > Control Panel > Administrative Tools > Performance Monitor or you can launch PerfMon.exe. Once this is running you will get an interface like the following:
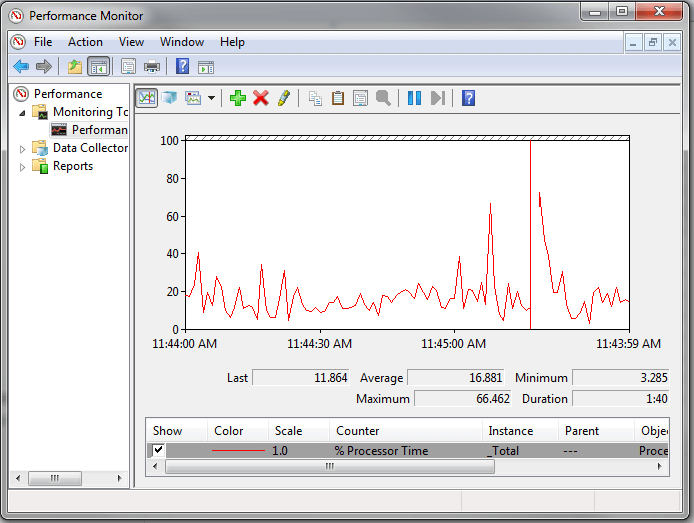
Above is the default look and feel when you launch this tool. Here we can see there is one counter “% Processor Time” that is being tracked. For this counter we can see the following items:
- Last – this is the last value that was captured for this counter
- Average – this is the average value for the duration
- Minimum – this is the minimum value for the duration
- Maximum – this is the maximum value for the duration
- Duration – this is the total collection time period and in this case it is 1:40 which is 1 minute and 40 seconds
From this we can tell when there are peaks for specific counters that may be causing performance issues.
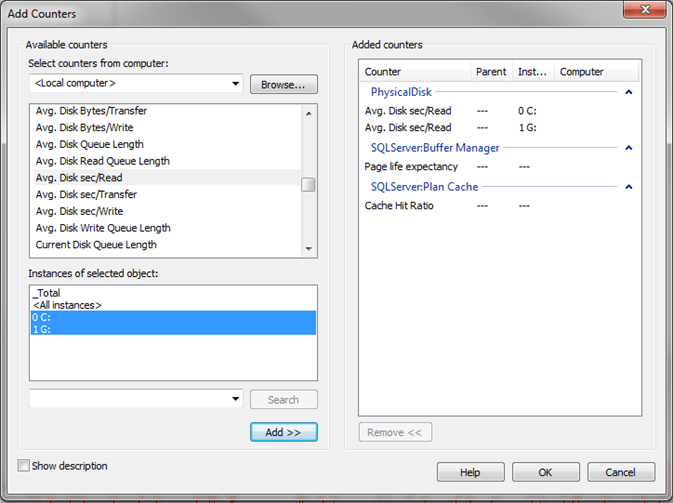
Adding Counters and Changing Settings
To add a counter, right click on the big green plus button above the graph and a new window will open like the following:
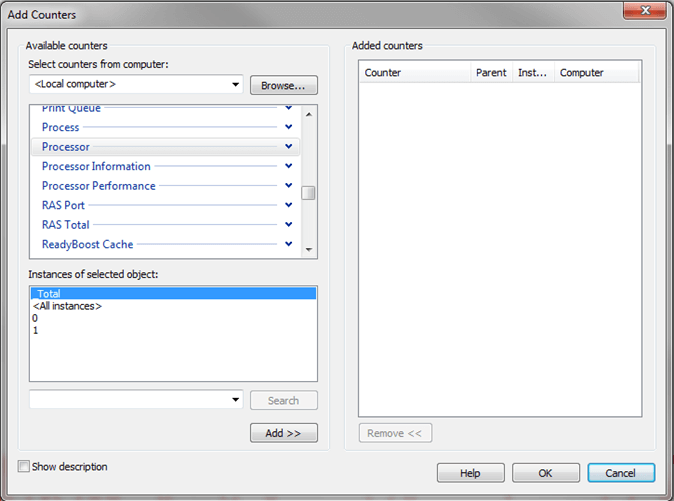
From this window we can select additional counters such as Memory, Physical Disk and SQL Server specific counters. To add a counter select the counter and click the Add button. The below screen shot shows multiple counters that have been selected. Click OK when you are done to start capturing this data.
The other thing you will want to do is change your duration and frequency for collecting data. By default it is set to sample the data every 1 second for a duration of 100 seconds. To change this right click on the graph and select Properties and a new window like the following will appear. If you click on the General tab you can set the sampling settings as shown below. In addition there are several other properties you can modify in this window.
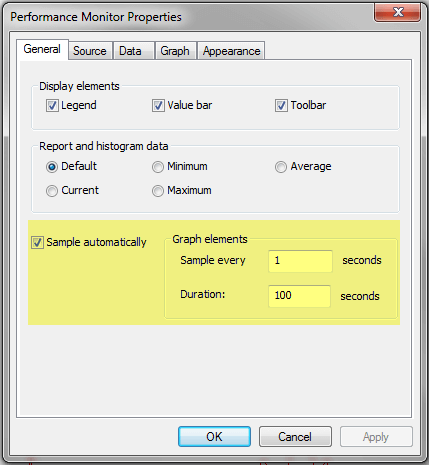
Once you click OK these settings will go in to effect immediately.
Useful Counters
Once you start to explore all of the counters it can be overwhelming since there are so many to choose from, so here are a few counters that would make sense to begin capturing. Also, once you start collecting it is also difficult to tell if you have an issue or not based on the values that are returned. Since there are no hard and fast rules for all counters the best approach is to capture these values when your system is running fine, so you can create a baseline. Then you can use these baseline numbers when you start to capture data. You can find some information online about specific counters and threshold values for each counter.
- Memory
- Available MBytes
- Physical Disk
- Avg. Disk sec/Read
- Avg. Disk sec/Write
- Processor
- % Processor Time
- SQL Server: Buffer Manager
- Page Life Expectancy
- Buffer cache hit ratio
- SQL Server: SQL Statistics
- Batch Requests/sec
- Compilations/sec
Built in Performance Reports in SSMS
Overview
Another way to get performance related information from SQL Server is to use the built-in performance reports. The reports were first introduced with SQL Server 2005 as an add-on, but are now standard with later versions. The reports provide useful information that can assist you in determining where your performance bottlenecks may be. The data from these reports is pulled from DMVs as well as the default trace that is always running.
Explanation
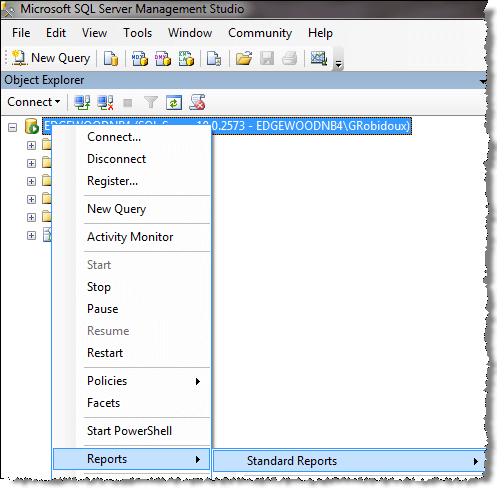
To access the reports, open SSMS, right click on the SQL Server instance name and select Reports > Standard Reports as shown below.
There are several reports related to performance that can be used to see current activity as well as historical activity. Here is a list of some of the available reports.
- Server Dashboard
- Scheduler Health
- Memory Consumption
- Activity – All Blocking Transactions
- Activity – Top Sessions
- Activity – top Connections
- Top Connections by Block Transactions Count
- Top Transaction by Locks Count
- Performance – Batch Execution Statistics
- Performance – Object Execution Statistics
- Performance – Top Queries by Average CPU Time
- Performance – Top Queries by Average IO
- Performance – Top Queries by Total CPU Time
- Performance – Top Queries by Total IO
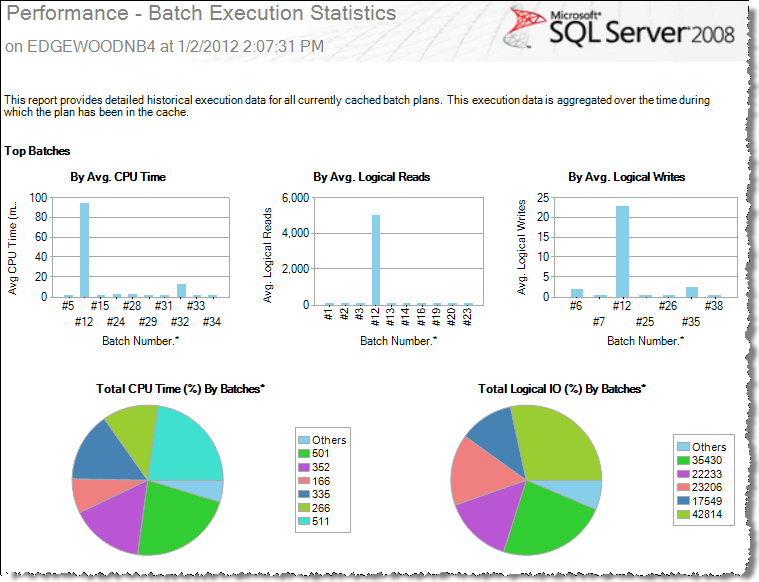
Here is a sample Performance – Batch Execution Statistics report:
Take the time to explore these reports to determine which report best suits your performance monitoring needs.
Query Execution Plans
Overview
Another useful tool that SQL Server offers is the ability to see query execution plans. An execution plan shows you how SQL Server breaks down a query and also identifies where issues might exist within the execution plan. Once you have identified statements that take a long time to complete, you can then look at the execution plan to determine tuning needs.
Explanation
The Query Execution Plans describe the steps and the order used to access or modify data in the database. Once you have this information you can identify what parts of the query are slow.
SQL Server can create execution plans in two ways:
- Actual Execution Plan – (CTRL + M) – is created after execution of the query and contains the steps that were performed
- Estimated Execution Plan – (CTRL + L) – is created without executing the query and contains an approximate execution plan
Execution plans can be presented in these three ways and each option offers benefits over the other.
- Text Plans
- Graphical Plans
- XML Plans
When beginning to work with execution plans, the graphical plan is usually the easiest place to start unless your plan is very complex, then the text plans are sometimes easier to read.
Here is a simple query and its execution plan. To include the Actual Execution Plan press CTRL + M in the query window and then execute the T-SQL code.
-- query 1
SELECT ProductKey,ProductSubcategoryKey
FROM AdventureWorksDW..DimProduct
WHERE ProductKey<100
-- query 2
SELECT ProductKey,ProductSubcategoryKey
FROM AdventureWorksDW..DimProduct
WHERE Color<>'Silver'
Here we can see that query 1 is doing an Index Scan and query 2 is doing a Clustered Index Scan. We can also see that query 1 is 3% of the batch and query 2 is 97%. Also, we can see that SQL Server is recommending that we add a new nonclustered index for query 2. So based on this output we know that query 2 is something that should be addressed.
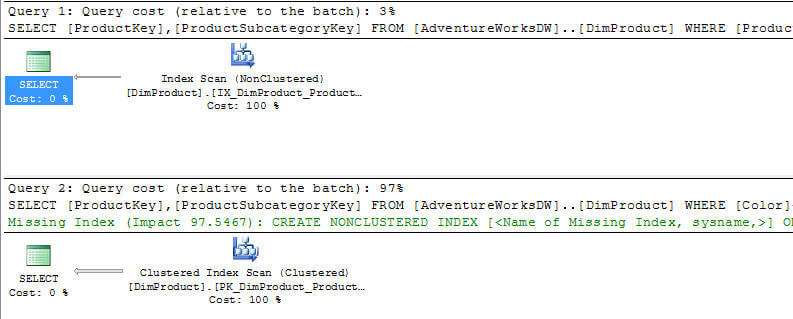
So you can see that once we have identified what queries are taking a long time using Profiler we can then look at the query execution plan to determine what needs to be tuned to make the query perform better. As with most things the more you use execution plans the easier it gets to identify the issue and what can be done to resolve the issue.
Note that not all execution plans are this simple and sometimes they are very difficult to read and interpret.
Database Engine Tuning Advisor
Overview
SQL Server also includes another performance tool called the Database Engine Tuning Advisor or DTA. This tool allows you to have SQL Server analyze one statement or a batch of statements that you captured by running a Profiler or server side trace. The tool will then go through each statement to determine where improvements can be made and then presents you with options for improvement.
Explanation
The Database Engine Tuning Advisor is basically a tool that helps you figure out if additional indexes are helpful as well as partitioning. Here is a summary of the options:
- Adding indexes (clustered, non-clustered, and indexed views)
- Adding partitioning
- Adding statistics including multi-column statistics which are not created automatically even when you have the AUTO_CREATE_STATISTICS database option set to ON
In addition to identifying opportunities for improvement, DTA will also create a T-SQL script that you can run to actually implement its recommendations.
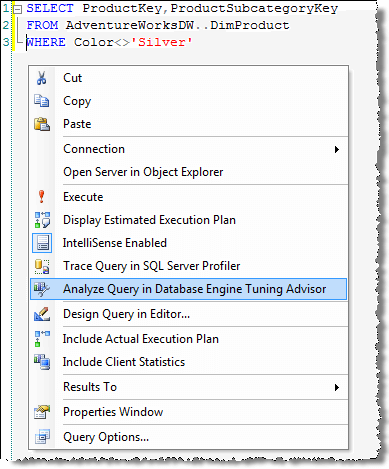
Here is an example of a query and how we can use DTA to analyze the query and make recommendations. From within a query window right click and select the DTA option as shown.
Here are the available options for tuning.
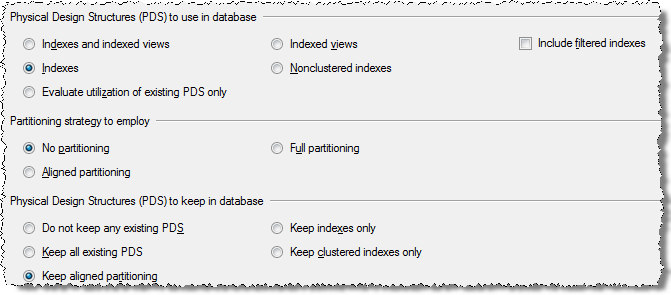
After you select the specific options click on Start Analysis and this will run the DTA tool to identity any potential improvements.
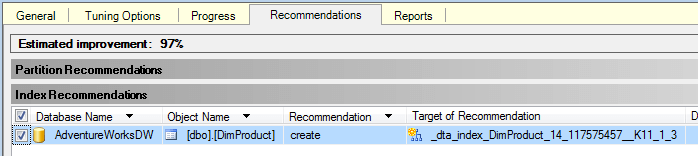
Here we can see that DTA recommends adding a new index for table DimProduct.
The Database Engine Tuning Advisor can also be launched from within SSMS by clicking on Tools > Database Engine Tuning Advisor.
Performance Issues
Overview
There are several factors that can degrade SQL Server performance and in this section we will investigate some of the common areas that can effect performance. We will look at some of the tools that you can use to identify issues as well as review some possible remedies to fix these performance issues.
We will cover the following topics:
- Blocking
- Deadlocks
- I/O
- CPU
- Memory
- Role of statistics
- Query Tuning Bookmark Lookups
- Query Tuning Index Scans
Troubleshooting Blocking
Overview
In order for SQL Server to maintain data integrity for both reads and writes it uses locks, so that only one process has control of the data at any one time. There are serveral types of locks that can be used such as Shared, Update, Exclusive, Intent, etc… and each of these has a different behavior and effect on your data.
When locks are held for a long period of time they cause blocking, which means one process has to wait for the other process to finish with the data and release the lock before the second process can continue. This is similar to deadlocking where two processes are waiting on the same resource, but unlike deadlocking, blocking is resolved as soon as the first process releases the resource.
Explanation
As mentioned above, blocking is a result of two processes wanting to access the same data and the second process needs to wait for the first process to release the lock. This is how SQL Server works all of the time, but usually you do not see blocking because the time that locks are held is usually very small.
It probably makes sense that locks are held when updating data, but locks are also used when reading data. When data is updated an Update lock is used and when data is read a Shared lock is used. An Update lock will create an exclusive lock on the data for this process and a Shared lock allows other processes that use a Shared lock to access the data as well and when two processes are trying to access the same data this is where the locking and blocking occurs.
Here are various ways you can identify blocking for your SQL Server instance.
sp_who2
In a query window run this command:
This is the output that is returned. Here we can see the BlkBy column that shows SPID 60 is blocked by SPID 59.

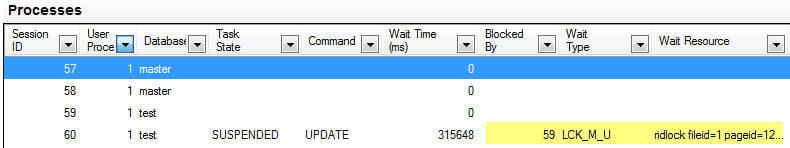
Activity Monitor
In SSMS, right click on the SQL Server instance name and select Activity Monitor. In the Processes section you will see information similar to below. Here we can see similar information as sp_who2, but we can also see the Wait Time, Wait Type and also the resource that SPID 60 is waiting for.
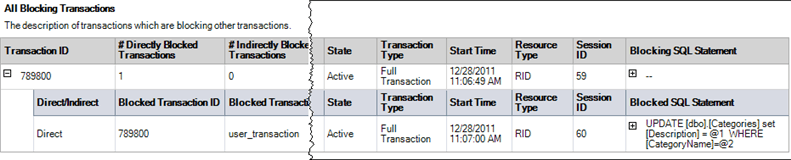
Report – All Blocking Transactions
Another option is to use the built in reports in SSMS. Right click on the SQL Server instance name and select Reports > Standard Reports > Activity – All Block Transactions.
Querying Dynamic Management Views
You can also use the DMVs to get information about blocking.
SELECT session_id, command, blocking_session_id, wait_type, wait_time, wait_resource, t.TEXT
FROM sys.dm_exec_requests
CROSS apply sys.dm_exec_sql_text(sql_handle) AS t
WHERE session_id > 50
AND blocking_session_id > 0
UNION
SELECT session_id, '', '', '', '', '', t.TEXT
FROM sys.dm_exec_connections
CROSS apply sys.dm_exec_sql_text(most_recent_sql_handle) AS t
WHERE session_id IN (SELECT blocking_session_id
                    FROM sys.dm_exec_requests
                    WHERE blocking_session_id > 0)
Here is the output and we can see the blocking information along with the TSQL commands that were issued.

Tracing a SQL Server Deadlock
Overview
A common issue with SQL Server is deadlocks. A deadlock occurs when two or more processes are waiting on the same resource and each process is waiting on the other process to complete before moving forward. When this situation occurs and there is no way for these processes to resolve the conflict, SQL Server will choose one of processes as the deadlock victim and rollback that process, so the other process or processes can move forward.
By default when this occurs, your application may see or handle the error, but there is nothing that is captured in the SQL Server Error Log or the Windows Event Log to let you know this occurred. The error message that SQL Server sends back to the client is similar to the following:
Msg 1205, Level 13, State 51, Line 3
Transaction (Process ID xx) was deadlocked on {xxx} resources with another process
and has been chosen as the deadlock victim. Rerun the transaction.
In this tutorial we cover what steps you can take to capture deadlock information and some steps you can take to resolve the problem.
Explanation
Deadlock information can be captured in the SQL Server Error Log or by using Profiler / Server Side Trace.
Trace Flags
If you want to capture this information in the SQL Server Error Log you need to enable one or both of these trace flags.
- 1204 – this provides information about the nodes involved in the deadlock
- 1222 – returns deadlock information in an XML format
You can turn on each of these separately or turn them on together.
To turn these on you can issue the following commands in a query window or you can add these as startup parameters. If these are turned on from a query window, the next time SQL Server starts these trace flags will not be active, so if you always want to capture this data the startup parameters is the best option.
DBCC TRACEON (1222, -1)
Here is sample output for each of the trace flags.
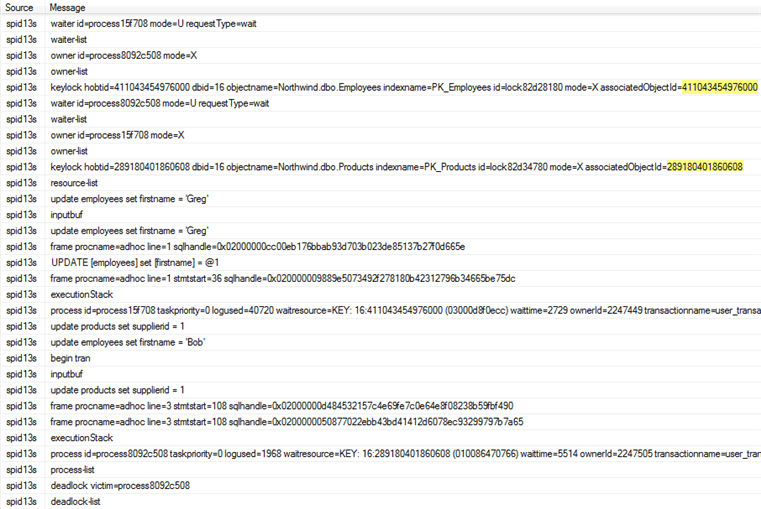
Trace Flag 1222 Output
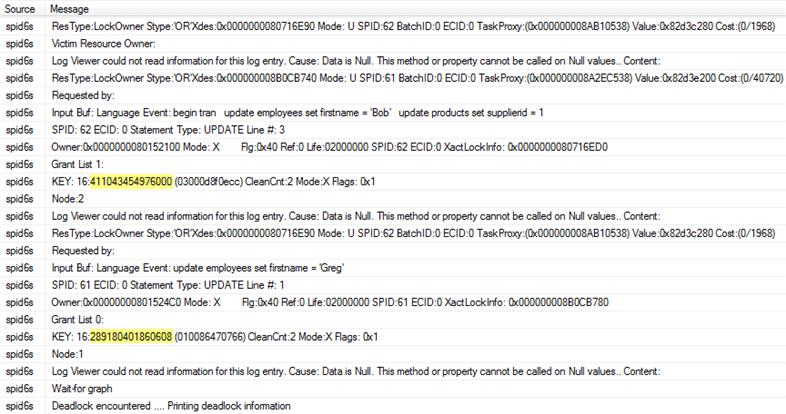
Trace Flag 1204 Output
Profiler / Server Side Trace
Profiler works without the trace flags being turned on and there are three events that can be captured for deadlocks. Each of these events is in the Locks event class.
- Deadlock graph – Occurs simultaneously with the Lock:Deadlock event class. The Deadlock Graph event class provides an XML description of the deadlock.
- Lock: Deadlock – Indicates that two concurrent transactions have deadlocked each other by trying to obtain incompatible locks on resources that the other transaction owns.
- Lock: Deadlock Chain – Is produced for each of the events leading up to the deadlock.
Event Output
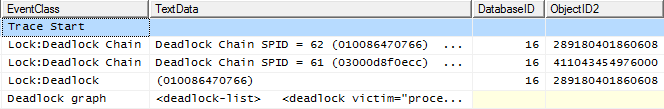
In the below image, I have only captured the three events mentioned above.
Deadlock Graph Output
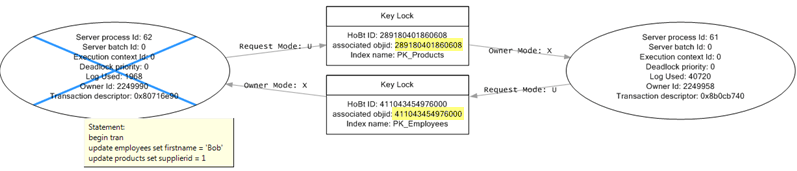
Below is the deadlock graph which is the output for the Deadlock graph event. We can see on the left side that server process id 62 was selected as the deadlock victim. Also, if you hover over the oval with the X through it we can see the transaction that was running.
Finding Objects Involved in Deadlock
In all three outputs, I have highlighted the object IDs for the objects that are in contention. You can use the following query to find the object, substituting the object ID for the partition_id below.
OBJECT_NAME([object_id])
FROM sys.partitions
WHERE partition_id = 289180401860608;
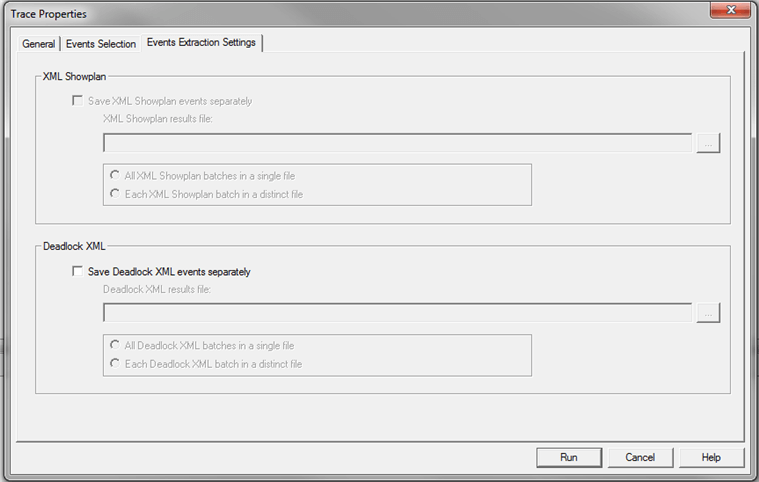
Saving Deadlock Graph Data in XML File
Since the deadlock graph data is stored in an XML format, you can save the XML events separately. When configuring the Trace Properties click on the Events Extraction Settings and enable this option as shown below.
Index Scans and Table Scans
Overview
There are several things that you can do to improve performance by throwing more hardware at the problem, but usually the place you get the most benefit from is when you tune your queries. One common problem that exists is the lack of indexes or incorrect indexes and therefore SQL Server has to process more data to find the records that meet the queries criteria. These issues are known as Index Scans and Table Scans.
In this section will look at how to find these issues and how to resolve them.
Explanation
An index scan or table scan is when SQL Server has to scan the data or index pages to find the appropriate records. A scan is the opposite of a seek, where a seek uses the index to pinpoint the records that are needed to satisfy the query. The reason you would want to find and fix your scans is because they generally require more I/O and also take longer to process. This is something you will notice with an application that grows over time. When it is first released performance is great, but over time as more data is added the index scans take longer and longer to complete.
To find these issues you can start by running Profiler or setting up a server side trace and look for statements that have high read values. Once you have identified the statements then you can look at the query plan to see if there are scans occurring.
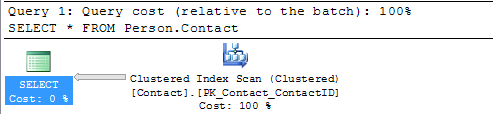
Here is a simple query that we can run. First use Ctrl+M to turn on the actual execution plan and then execute the query.
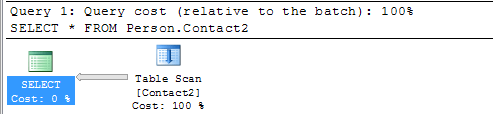
Here we can see that this query is doing a Clustered Index Scan. Since this table has a clustered index and there is not a WHERE clause SQL Server scans the entire clustered index to return all rows. So in this example there is nothing that can be done to improve this query.
In this next example I created a new copy of the Person.Contact table without a clustered index and then ran the query.
Here we can see that this query is doing a Table Scan, so when a table has a Clustered Index it will do a Clustered Index Scan and when the table does not have a clustered index it will do a Table Scan. Since this table does not have a clustered index and there is not a WHERE clause SQL Server scans the entire table to return all rows. So again in this example there is nothing that can be done to improve this query.
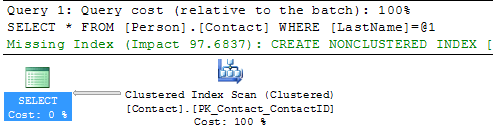
In this next example we include a WHERE clause for the query.
Here we can see that we still get the Clustered Index Scan, but this time SQL Server is letting us know there is a missing index. If you right click on the query plan and select Missing Index Details you will get a new window with a script to create the missing index.
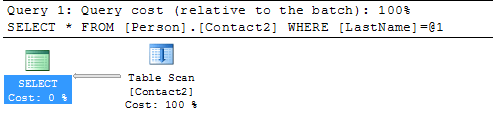
Let’s do the same thing for our Person.Contact2 table.
We can see that we still have the Table Scan, but SQL Server doesn’t offer any suggestions on how to fix this.
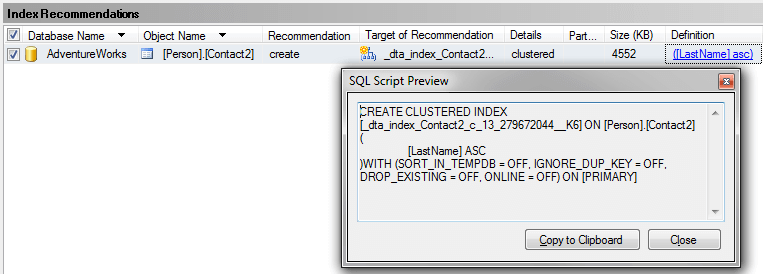
Another thing you could do is use the Database Engine Tuning Advisor to see if it gives you any suggestions. If I select the query in SSMS, right click and select Analyze Query in Database Engine Tuning Advisor the tools starts up and I can select the options and start the analysis.
Below is the suggestion this tool provides and we can see that recommends creating a new index, so you can see that using both tools can be beneficial.
Create New Index
So let’s create the recommended index on Person.Contact and run the query again.
USE [AdventureWorks]
GO
CREATE NONCLUSTERED INDEX [IX_LastName]
ON [Person].[Contact] ([LastName])
GO
SELECT * FROM Person.Contact WHERE LastName = 'Russell'
Here we can see the query plan has changed and instead of a Clustered Index Scan we now have an Index Seek which is much better. We can also see that there is now a Key Lookup operation which we will talk about in the next section.
Summary
By finding and fixing your Index Scans and Table Scans you can drastically improve performance especially for larger tables. So take the time to identify where your scans may be occurring and create the necessary indexes to solve the problem. One thing that you should be aware of is that too many indexes also causes issues, so make sure you keep a balance on how many indexes you create for a particular table.
Eliminating bookmark (key/rid) lookups
Overview
When we were looking at the index scan and table scan section we were able to eliminate the scan which was replaced with an index seek, but this also introduced a Key Lookup which is something else you may want to eliminate to improve performance.
A key lookup occurs when data is found in a non-clustered index, but additional data is needed from the clustered index to satisfy the query and therefore a lookup occurs. If the table does not have a clustered index then a RID Lookup occurs instead.
In this section we will look at how to find Key/RID Lookups and ways to eliminate them.
Explanation
The reason you would want to eliminate Key/RID Lookups is because they require an additional operation to find the data and may also require additional I/O. I/O is one of the biggest performance hits on a server and any way you can eliminate or reduce I/O is a performance gain.
So let’s take a look at an example query and the query plan. Before we do this we want to first add the nonclustered index on LastName.
USE [AdventureWorks]
GO
CREATE NONCLUSTERED INDEX [IX_LastName]
ON [Person].[Contact] ([LastName])
GO
Now we can use Ctrl+M to turn on the actual execution plan and run the select.
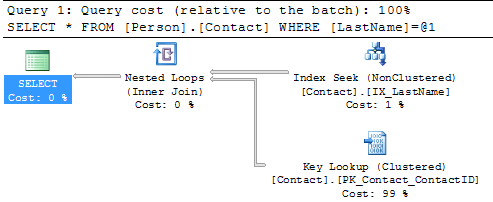
SELECT * FROM Person.Contact WHERE LastName = 'Russell'
If we look at the execution plan we can see that we have an Index Seek using the new index, but we also have a Key Lookup on the clustered index. The reason for this is that the nonclustered index only contains the LastName column, but since we are doing a SELECT * the query has to get the other columns from the clustered index and therefore we have a Key Lookup. The other operator we have is the Nested Loops this joins the results from the Index Seek and the Key Lookup.

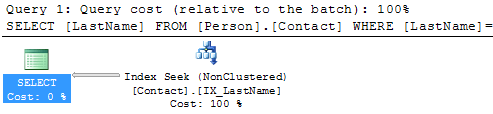
So if we change the query as follows and run this again you can see that the Key Lookup disappears, because the index includes all of the columns.
SELECT LastName FROM Person.Contact WHERE LastName = 'Russell'
Here we can see that we no longer have a Key Lookup and we also no longer have the Nested Loops operator.
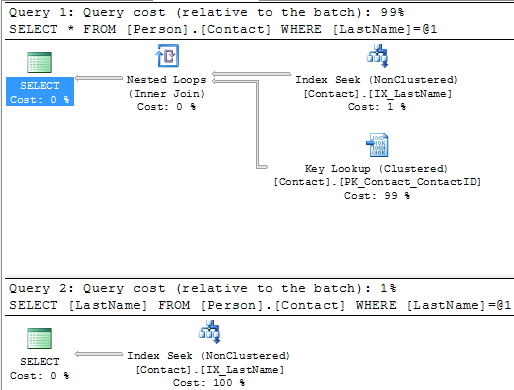
If we run both of these queries at the same time in one batch we can see the improvement by removing these two operators.
SELECT * FROM Person.Contact WHERE LastName = 'Russell'
SELECT LastName FROM Person.Contact WHERE LastName = 'Russell'
Below we can see that the first statement takes 99% of the batch and the second statement takes 1%, so this is a big improvement.
This should make sense that since the index includes LastName and that is the only column that is being used for both the SELECTed columns and the WHERE clause the index can handle the entire query. Another thing to be aware of is that if the table has a clustered index we can include the clustered index column or columns as well without doing a Key Lookup.
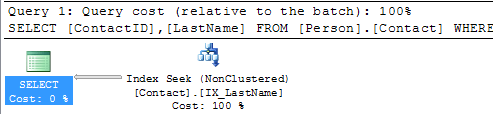
The Person.Contact table has a clustered index on ContactID, so if we include this column in the query we can still do just an Index Seek.
SELECT ContactID, LastName FROM Person.Contact WHERE LastName = 'Russell'
Here we can see that we only need to do an Index Seek to include both of these columns.
So that’s great if that is all you need, but what if you need to include other columns such as FirstName. If we change the query as follows then the Key Lookup comes back again.
SELECT FirstName, LastName FROM Person.Contact WHERE LastName = 'Russell'
Luckily there are a few options to handle this.
Creating a Covering Index
A covering index basically does what it implies, it covers the query by including all of the columns that are needed. So if our need is to always include FirstName and LastName we can modify our index as follows to include both LastName and FirstName.
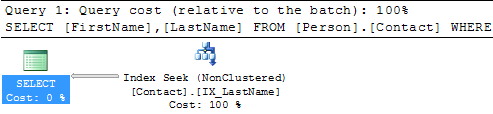
DROP INDEX [IX_LastName] ON [Person].[Contact]
GO
CREATE NONCLUSTERED INDEX [IX_LastName]
ON [Person].[Contact] ([LastName], [FirstName])
GO
And if we look at the execution plan we can see that we eliminated the Key Lookup once again.
Creating an Index with Included Columns
Another option is to use the included columns feature for an index. This allows you to include additional columns so they are stored with the index, but are not part of the index tree. So this allows you to take advantage of the features of a covering index and reduces storage needs within the index tree. Another benefit is that you can include additional data types that can not be part of a covering index.
The syntax for the the index with included columns is as follows:
DROP INDEX [IX_LastName] ON [Person].[Contact]
GO
CREATE NONCLUSTERED INDEX [IX_LastName]
ON [Person].[Contact] ([LastName])
INCLUDE ([FirstName])
GO
Here we can see the exuection plan is the same for both options.
Discovering Unused Indexes
Overview
To ensure that data access can be as fast as possible, SQL Server like other relational database systems utilizes indexing to find data quickly. SQL Server has different types of indexes that can be created such as clustered indexes, non-clustered indexes, XML indexes and Full Text indexes.
The benefit of having more indexes is that SQL Server can access the data quickly if an appropriate index exists. The downside to having too many indexes is that SQL Server has to maintain all of these indexes which can slow things down and indexes also require additional storage. So as you can see indexing can both help and hurt performance.
In this section we will focus on how to identify indexes that exist, but are not being used and therefore can be dropped to improve performance and decrease storage requirements.
Explanation
When SQL Server 2005 was introduced it added Dynamic Management Views (DMVs) that allow you to get additional insight as to what is going on within SQL Server. One of these areas is the ability to see how indexes are being used. There are two DMVs that we will discuss. Note that these views store cumulative data, so when SQL Server is restated the counters go back to zero, so be aware of this when monitoring your index usage.
DMV – sys.dm_db_index_operational_stats
This DMV allows you to see insert, update and delete information for various aspects for an index. Basically this shows how much effort was used in maintaining the index based on data changes.
If you query the table and return all columns, the output may be confusing. So the query below focuses on a few key columns. To learn more about the output for all columns you can check out Books Online.
SELECT OBJECT_NAME(A.[OBJECT_ID]) AS [OBJECT NAME],
       I.[NAME] AS [INDEX NAME],
       A.LEAF_INSERT_COUNT,
       A.LEAF_UPDATE_COUNT,
       A.LEAF_DELETE_COUNT
FROM   SYS.DM_DB_INDEX_OPERATIONAL_STATS (db_id(),NULL,NULL,NULL ) A
       INNER JOIN SYS.INDEXES AS I
         ON I.[OBJECT_ID] = A.[OBJECT_ID]
            AND I.INDEX_ID = A.INDEX_ID
WHERE  OBJECTPROPERTY(A.[OBJECT_ID],'IsUserTable') = 1
Below we can see the number of Inserts, Updates and Deletes that occurred for each index, so this shows how much work SQL Server had to do to maintain the index.

DMV – sys.dm_db_index_usage_stats
This DMV shows you how many times the index was used for user queries. Again there are several other columns that are returned if you query all columns and you can refer to Books Online for more information.
SELECT OBJECT_NAME(S.[OBJECT_ID]) AS [OBJECT NAME],
       I.[NAME] AS [INDEX NAME],
       USER_SEEKS,
       USER_SCANS,
       USER_LOOKUPS,
       USER_UPDATES
FROM   SYS.DM_DB_INDEX_USAGE_STATS AS S
       INNER JOIN SYS.INDEXES AS I ON I.[OBJECT_ID] = S.[OBJECT_ID] AND I.INDEX_ID = S.INDEX_ID
WHERE  OBJECTPROPERTY(S.[OBJECT_ID],'IsUserTable') = 1
       AND S.database_id = DB_ID()
Here we can see seeks, scans, lookups and updates.
- The seeks refer to how many times an index seek occurred for that index. A seek is the fastest way to access the data, so this is good.
- The scans refers to how many times an index scan occurred for that index. A scan is when multiple rows of data had to be searched to find the data. Scans are something you want to try to avoid.
- The lookups refer to how many times the query required data to be pulled from the clustered index or the heap (does not have a clustered index). Lookups are also something you want to try to avoid.
- The updates refers to how many times the index was updated due to data changes which should correspond to the first query above.

Identifying Unused Indexes
So based on the output above you should focus on the output from the second query. If you see indexes where there are no seeks, scans or lookups, but there are updates this means that SQL Server has not used the index to satisfy a query but still needs to maintain the index. Remember that the data from these DMVs is reset when SQL Server is restarted, so make sure you have collected data for a long enough period of time to determine which indexes may be good candidates to be dropped.
Investigating I/O bottlenecks
Overview
SQL Server is usually a high I/O activity process and in most cases the database is larger than the amount of memory installed on a computer and therefore SQL Server has to pull data from disk to satisfy queries. In addition, since the data in databases is constantly changing these changes need to be written to disk. Another process that can consume a lot of I/O is the TempDB database. The TempDB database is a temporary working area for SQL Server to do such things as sorting and grouping. The TempDB database also resides on disk and therefore depending on how many temporary objects are created this database could be busier than your user databases.
Since I/O is such an important part of SQL Server performance you need to make sure your disk subsystem is not the bottleneck. In the old days this was much easier to do, since most servers had local attached storage. These days most SQL Servers use SAN or NAS storage or to further complicate things more and more SQL Servers are running in a virtualized environment.
Explanation
There are several different methods that can be used to track I/O performance, but as mentioned above with SAN / NAS storage and virtualized SQL Server environments, this is getting harder and harder to track as well as the rules have changed as far as what should be tracked to determine if there is an I/O bottleneck. The advantage is that there are several tools available at both the storage level and the virtual level to aid in performance, but we will not cover these here.
There are basically two options that you have to monitor I/O bottlenecks, SQL Server DMVs and Performance Monitor counters. There are other tools as well, but these are two options that will exist in every SQL Server environment.
DMV – sys.dm_io_virtual_file_stats
This DMV will give you cumulative file stats for each database and each database file including both the data and log files. Based on this data you can determine which file is the busiest from a read and/or write perspective.
The output also includes I/O stall information for reads, writes and total. The I/O stall is the total time, in milliseconds, that users waited for I/O to be completed on the file. By looking at the I/O stall information you can see how much time was waiting for I/O to complete and therefore the users were waiting.
The data that is returned from this DMV is cumulative data, which means that each time you restart SQL Server the counters are reset. Since the data is cumulative you can run this once and then run the query again in the future and compare the deltas for the two time periods. If the I/O stalls are high compared to the length of the that time period then you may have an I/O bottleneck.
SELECT
cast(DB_Name(a.database_id) as varchar) as Database_name,
b.physical_name, *
FROM
sys.dm_io_virtual_file_stats(null, null) a
INNER JOIN sys.master_files b ON a.database_id = b.database_id and a.file_id = b.file_id
ORDER BY Database_Name
Here is partial output from the above command.
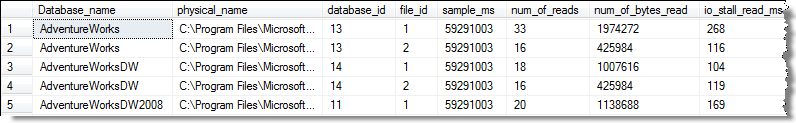
Performance Monitor
Performance Monitor is a Windows tool that let’s you capture statistics about SQL Server, memory usage, I/O usage, etc… This tool can be run interactively using the GUI or you can set it up to collected information behind the scenes which can be reviewed at a later time. This tool is found in the Control Panel under Administrative tools.
There are several counters related to I/O and they are located under Physical Disk and Logical Disk. The Physical Disk performance object consists of counters that monitor hard or fixed disk drive on a computer. The Logical Disk performance object consists of counters that monitor logical partitions of a hard or fixed disk drives. For the most part, they both contain the same counters. In most cases you will probably use the Physical Disk counters. Here is a partial list of the available counters.
Now that storage could be either local, SAN, NAS, etc… these two counters are helpful to see if there is a bottleneck:
- Avg. Disk sec/Read is the average time, in seconds, of a read of data from the disk.
- Avg. Disk sec/Write is the average time, in seconds, of a write of data to the disk.
The recommendation is that the values for both of these counters be less than 20ms. When you capture this data the values will be displayed as 0.000, so a value of 0.050 equals 50ms.
Resource Monitor
Another tool that you can use is the Resource Monitor. This can be launched from Task Manager or from the Control Panel.
Below you can see the Disk tab that shows current processes using disk, the active disk files and storage at the logical and physical level. The Response Time (ms) is helpful to see how long it is taking to service the I/O request.
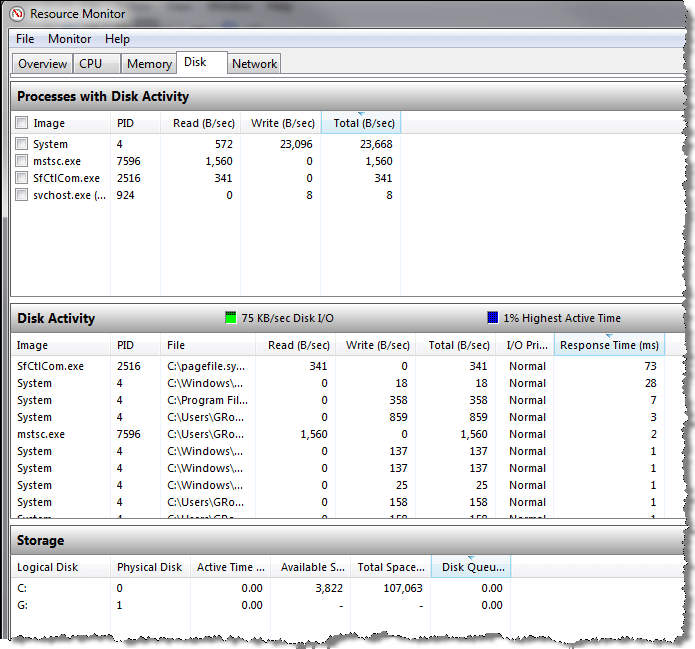
How to Resolve the ‘Cannot connect to WMI provider’ Error in SQL Configuration Manager

Cause
Workaround
Note For this command to succeed, the Sqlmgmproviderxpsp2up.mof file must be present in the %programfiles(x86)%\Microsoft SQL Server\number\Shared folder.
| Microsoft SQL Server 2012 | 110 |
| Microsoft SQL Server 2008 R2 | 100 |
| Microsoft SQL Server 2008 | 100 |
| Microsoft SQL Server 2005 | 90 |
After you run the Mofcomp tool, restart the WMI service for the changes to take effect. The service name is Windows management Instrumentation.
SQL Server Monitoring – Automating SQL Server Health Checks (SQL Server 2005 & Above)
DECLARE @ServerIP VARCHAR(100), @Project VARCHAR(100),
@Recepients VARCHAR(2000), @MailProfile VARCHAR(100),
@Owner VARCHAR(200)
SET @ServerIP = '.' -- SQL Server 2012 Database Server IP Address
set @Project = 'Aveva' -- Name of project or client
set @Recepients = 'debadatta.parida@aveva.com' -- Recepient(s) of this email (; separated in case of multiple recepients).
set @MailProfile = 'Dev' -- Mail profile name which exists on the target database server
set @Owner = 'Debadatta'
SET NOCOUNT ON
/* Drop all the temp tables(not necessary at all as local temp tables get dropped as soon as session is released,
however, good to follow this practice). */
If exists (select * from tempdb.sys.all_objects where name like '#jobs_status%' )
BEGIN
DROP TABLE #jobs_status
END
If exists (select * from tempdb.sys.all_objects where name like '#diskspace%' )
BEGIN
DROP TABLE #diskspace
END
If exists (select * from tempdb.sys.all_objects where name like '#url%' )
BEGIN
DROP TABLE #url
END
If exists (select * from tempdb.sys.all_objects where name like '#dirpaths%' )
BEGIN
DROP TABLE #dirpaths
END
-- Create the temp tables which will be used to hold the data.
CREATE TABLE #url
(
idd INT IDENTITY (1,1),
url VARCHAR(1000)
)
CREATE TABLE #dirpaths
(
files VARCHAR(2000)
)
--CREATE TABLE #diskspace
--(
-- drive VARCHAR(200),
-- diskspace INT
--)
-- This table will hold data from sp_help_job (System sp in MSDB database)
/*
CREATE TABLE #jobs_status
(
job_id UNIQUEIDENTIFIER,
originating_server NVARCHAR(30),
name SYSNAME,
enabled TINYINT,
description NVARCHAR(512),
start_step_id INT,
category SYSNAME,
owner SYSNAME,
notify_level_eventlog INT,
notify_level_email INT,
notify_level_netsend INT,
notify_level_page INT,
notify_email_operator SYSNAME,
notify_netsend_operator SYSNAME,
notify_page_operator SYSNAME,
delete_level INT,
date_created DATETIME,
date_modified DATETIME,
version_number INT,
last_run_date INT,
last_run_time INT,
last_run_outcome INT,
next_run_date INT,
next_run_time INT,
next_run_schedule_id INT,
current_execution_status INT,
current_execution_step SYSNAME,
current_retry_attempt INT,
has_step INT,
has_schedule INT,
has_target INT,
type INT
)
*/
-- To insert data in couple of temp tables created above.
-- INSERT #diskspace(drive, diskspace) EXEC xp_fixeddrives
SELECT DISTINCT dovs.volume_mount_point AS Drive,
CONVERT(decimal,dovs.available_bytes/1048576/1024) AS FreeSpaceInGB,
convert(decimal,dovs.total_bytes/1048576/1024) as TotalSpaceInGB,
cast(CONVERT(decimal,dovs.available_bytes/1048576/1024)/convert(decimal,dovs.total_bytes/1048576/1024)*100 as decimal(38,2)) as FreeSpaceInPct
into #diskspace
FROM sys.master_files mf
CROSS APPLY sys.dm_os_volume_stats(mf.database_id, mf.FILE_ID) dovs
ORDER BY FreeSpaceInGB ASC
select sj.job_id, sj.name, sc.name as Category, sj.Enabled, sjs.last_run_outcome,
(SELECT top 1 endTime = CONVERT
( DATETIME, RTRIM(run_date)) + ( run_time * 9 + run_time % 10000 * 6 + run_time % 100 * 10 + 25 * run_duration) / 216e4
FROM msdb..sysjobhistory sjh where sjh.job_id = sj.job_id order by run_date desc, run_time desc) as last_run_date
into #jobs_status
from msdb..sysjobs sj
join msdb..syscategories sc
on sj.category_id = sc.category_id
join msdb.dbo.sysjobservers sjs
on sjs.job_id = sj.job_id
-- Variable declaration
DECLARE @TableHTML VARCHAR(MAX),
@StrSubject VARCHAR(100),
@Oriserver VARCHAR(100),
@Version VARCHAR(250),
@Edition VARCHAR(100),
@ISClustered VARCHAR(100),
@SP VARCHAR(100),
@ServerCollation VARCHAR(100),
@SingleUser VARCHAR(5),
@LicenseType VARCHAR(100),
@StartDate DATETIME,
@EndDate DATETIME,
@Cnt int,
@URL varchar(1000),
@Str varchar(1000)
-- Variable Assignment
SELECT @Version = @@version
SELECT @Edition = CONVERT(VARCHAR(100), serverproperty('Edition'))
--SELECT @StartDate = CAST(CONVERT(VARCHAR(4), DATEPART(yyyy, GETDATE())) + '-' + CONVERT(VARCHAR(2), DATEPART(mm, GETDATE())) + '-01' AS DATETIME)
-- SELECT @StartDate = @StartDate - 1
SELECT @StartDate = getdate()-1
SELECT @EndDate = CAST(CONVERT(VARCHAR(5),DATEPART(yyyy, GETDATE() + 1)) + '-' + CONVERT(VARCHAR(2),DATEPART(mm, GETDATE() + 1)) + '-' + CONVERT(VARCHAR(2), DATEPART(dd, GETDATE() + 1)) AS DATETIME)
SET @Cnt = 0
IF serverproperty('IsClustered') = 0
BEGIN
SELECT @ISClustered = 'No'
END
ELSE
BEGIN
SELECT @ISClustered = 'YES'
END
SELECT @SP = CONVERT(VARCHAR(100), SERVERPROPERTY ('productlevel'))
SELECT @ServerCollation = CONVERT(VARCHAR(100), SERVERPROPERTY ('Collation'))
SELECT @LicenseType = CONVERT(VARCHAR(100), SERVERPROPERTY ('LicenseType'))
SELECT @SingleUser = CASE SERVERPROPERTY ('IsSingleUser')
WHEN 1 THEN 'Yes'
WHEN 0 THEN 'No'
ELSE
'null' END
SELECT @OriServer = CONVERT(VARCHAR(50), SERVERPROPERTY('computernamephysicalnetbios'))
SELECT @strSubject = 'Production DB Server Daily Health SunRise Report ('+ CONVERT(VARCHAR(50), SERVERPROPERTY('servername')) + ')'
SET @TableHTML =
'<font face="Verdana" size="4">Server Info</font>
<table border="1" cellpadding="0" cellspacing="0" style="border-collapse: collapse" bordercolor="#111111" id="AutoNumber1">
<tr>
<td bgcolor="#000080"><b>
<font face="Verdana" size="2" color="#FFFFFF">Server Name</font></b></td>
<td bgcolor="#000080"><b>
<font face="Verdana" size="2" color="#FFFFFF">Instance Name</font></b></td>
<td bgcolor="#000080"><b>
<font face="Verdana" size="2" color="#FFFFFF">Edition</font></b></td>
<td width="60%" bgcolor="#000080"><b>
<font face="Verdana" size="2" color="#FFFFFF">Version</font></b></td>
<td bgcolor="#000080"><b>
<font face="Verdana" size="2" color="#FFFFFF">IsClustered</font></b></td>
</tr>
<tr>
<td><font face="Verdana" size="2">' + @OriServer +'</font></td>
<td><font face="Verdana" size="2">' + @@servername +'</font></td>
<td><font face="Verdana" size="2">' + @edition +'</font></td>
<td><font face="Verdana" size="2">' + @version +'</font></td>
<td><font face="Verdana" size="2">' + @isclustered +'</font></td>
</tr>
</table>'
SELECT
@TableHTML = @TableHTML +
'<p style="margin-top: 1; margin-bottom: 0"> </p>
<font face="Verdana" size="4">Disk Stats</font>
<table id="AutoNumber1" style="BORDER-COLLAPSE: collapse" borderColor="#111111" height="40" cellSpacing="0" cellPadding="0" width="50%" border="1">
<tr>
<td bgColor="#000080" height="15"><b>
<font face="Verdana" size="1" color="#FFFFFF">Drive</font></b></td>
<td bgColor="#000080" height="15"><b>
<font face="Verdana" size="1" color="#FFFFFF">Free Space (GB)</font></b></td>
<td bgColor="#000080" height="15"><b>
<font face="Verdana" size="1" color="#FFFFFF">Total Space (GB)</font></b></td>
<td bgColor="#000080" height="15"><b>
<font face="Verdana" size="1" color="#FFFFFF">Free Space (%)</font></b></td>
</tr>'
SELECT
@TableHTML = @TableHTML +
'<tr><td><font face="Verdana" size="1">' + ISNULL(CONVERT(VARCHAR(100), drive), '') +'</font></td>' +
'<td><font face="Verdana" size="1">' + ISNULL(CONVERT(VARCHAR(100), FreeSpaceInGB), '') +'</font></td>' +
'<td><font face="Verdana" size="1">' + ISNULL(CONVERT(VARCHAR(100), TotalSpaceInGB), '') +'</font></td>' +
'<td'+case when FreeSpaceInPct < 15.00 then ' style="background-color:#F00;"' else ' style="background-color:#0F0;"' end +'><font face="Verdana" size="1">' + ISNULL(CONVERT(VARCHAR(100), FreeSpaceInPct), '') +'</font></td></tr>'
FROM
#diskspace
SELECT @TableHTML = @TableHTML + '</table>'
--========================---CPU stats
If exists (select * from tempdb.sys.all_objects where name like '#cpu_usage%' )
drop table #cpu_usage
declare @ts_now bigint
select @ts_now = ms_ticks from sys.dm_os_sys_info
select dateadd (ms, (y.[timestamp] -@ts_now), GETDATE()) as EventTime,SQLProcessUtilization,SystemIdle, 100 - SystemIdle - SQLProcessUtilization as OtherProcessUtilization
into #cpu_usage
from ( select record.value('(./Record/@id)[1]', 'int') as record_id,
record.value('(./Record/SchedulerMonitorEvent/SystemHealth/SystemIdle)[1]', 'int')
as SystemIdle, record.value('(./Record/SchedulerMonitorEvent/SystemHealth/ProcessUtilization)[1]',
'int') as SQLProcessUtilization,
timestamp from ( select timestamp, convert(xml, record) as record from sys.dm_os_ring_buffers
where ring_buffer_type = N'RING_BUFFER_SCHEDULER_MONITOR'
and record like '%<SystemHealth>%') as x
) as y
order by record_id desc
--select * from #cpu_usage order by SQLProcessUtilization desc
SELECT @TableHTML = @TableHTML + '<p style="margin-top: 0; margin-bottom: 0"> </p>
<font face="Verdana" size="4">CPU Usage (%)</font>
<table style="BORDER-COLLAPSE: collapse" borderColor="#111111" cellPadding="0" bgColor="#ffffff" borderColorLight="#000000" border="1">
<tr>
<th align="left" bgColor="#000080">
<font face="Verdana" size="1" color="#FFFFFF">EventTime</font></th>
<th align="left" bgColor="#000080">
<font face="Verdana" size="1" color="#FFFFFF">SQLProcessUtilization</font></th>
<th align="left" bgColor="#000080">
<font face="Verdana" size="1" color="#FFFFFF">SystemIdle</font></th>
<th align="left" bgColor="#000080">
<font face="Verdana" size="1" color="#FFFFFF">OtherProcessUtilization</font></th>
</tr>'
SELECT top 10
@TableHTML = @TableHTML +
'<tr><td><font face="Verdana" size="1">' + ISNULL(CONVERT(VARCHAR(100), EventTime), '') +'</font></td>' +
'<td'+case when SQLProcessUtilization > 80 then ' style="background-color:#F00;"' else ' style="background-color:#0F0;"' end +'><font face="Verdana" size="1">' + ISNULL(CONVERT(VARCHAR(100), SQLProcessUtilization), '') +'</font></td>' +
'<td><font face="Verdana" size="1">' + ISNULL(CONVERT(VARCHAR(100), SystemIdle), '') +'</font></td>' +
'<td><font face="Verdana" size="1">' + ISNULL(CONVERT(VARCHAR(100), OtherProcessUtilization), '') +'</font></td></tr>'
FROM
#cpu_usage order by SQLProcessUtilization desc
SELECT @TableHTML = @TableHTML + '</table>'
--================cpu stats ends
--===============memory stats
If exists (select * from tempdb.sys.all_objects where name like '#memory_stats%' )
drop table #memory_stats
declare @bufferCacheHit decimal
SELECT @bufferCacheHit=cast((a.cntr_value * 1.0 / b.cntr_value) * 100.0 as decimal(38,2))
FROM sys.dm_os_performance_counters a
JOIN (SELECT cntr_value,OBJECT_NAME
FROM sys.dm_os_performance_counters
WHERE counter_name = 'Buffer cache hit ratio base'
AND OBJECT_NAME = 'SQLServer:Buffer Manager') b ON a.OBJECT_NAME = b.OBJECT_NAME
WHERE a.counter_name = 'Buffer cache hit ratio'
AND a.OBJECT_NAME = 'SQLServer:Buffer Manager'
SELECT @bufferCacheHit as BufferCacheHitRatio, physical_memory_kb/1024/1024 as PhysicaMemoryInGB, committed_kb/1024/1024 as SQLCommittedInGB
into #memory_stats
FROM sys.dm_os_sys_info
SELECT @TableHTML = @TableHTML + '<p style="margin-top: 0; margin-bottom: 0"> </p>
<font face="Verdana" size="4">Memory Usage</font>
<table style="BORDER-COLLAPSE: collapse" borderColor="#111111" cellPadding="0" bgColor="#ffffff" borderColorLight="#000000" border="1">
<tr>
<th align="left" bgColor="#000080">
<font face="Verdana" size="1" color="#FFFFFF">Buffer Cache Hit Ratio (%)</font></th>
<th align="left" bgColor="#000080">
<font face="Verdana" size="1" color="#FFFFFF">Total PhysicalMemory (GB)</font></th>
<th align="left" bgColor="#000080">
<font face="Verdana" size="1" color="#FFFFFF">SQLCommittedMemory (GB)</font></th>
</tr>'
SELECT
@TableHTML = @TableHTML +
'<tr><td><font face="Verdana" size="1">' + ISNULL(CONVERT(VARCHAR(100), BufferCacheHitRatio), '') +'</font></td>' +
'<td><font face="Verdana" size="1">' + ISNULL(CONVERT(VARCHAR(100), PhysicaMemoryInGB), '') +'</font></td>' +
'<td><font face="Verdana" size="1">' + ISNULL(CONVERT(VARCHAR(100), SQLCommittedInGB), '') +'</font></td></tr>'
FROM
#memory_stats
SELECT @TableHTML = @TableHTML + '</table>'
--===============memory stats ends
SELECT @TableHTML = @TableHTML + '<p style="margin-top: 0; margin-bottom: 0"> </p>
<font face="Verdana" size="4">Job Status</font>
<table style="BORDER-COLLAPSE: collapse" borderColor="#111111" cellPadding="0" width="100%" bgColor="#ffffff" borderColorLight="#000000" border="1">
<tr>
<th align="left" width="432" bgColor="#000080">
<font face="Verdana" size="1" color="#FFFFFF">Job Name</font></th>
<th align="left" width="85" bgColor="#000080">
<font face="Verdana" size="1" color="#FFFFFF">Last Run</font></th>
<th align="left" width="183" bgColor="#000080">
<font face="Verdana" size="1" color="#FFFFFF">Category</font></th>
<th align="left" width="136" bgColor="#000080">
<font face="Verdana" size="1" color="#FFFFFF">Last Run Date</font></th>
<th align="left" width="136" bgColor="#000080">
<font face="Verdana" size="1" color="#FFFFFF">Execution Time (Mi)</font></th>
</tr>'
SELECT
@TableHTML = @TableHTML + '<tr><td><font face="Verdana" size="1">' +
ISNULL(CONVERT(VARCHAR(100), A.name), '') +'</font></td>' +
CASE last_run_outcome
WHEN 0 THEN '<td bgColor="#ff0000"><b><blink><font face="Verdana" size="2">
<a href="mailto:Debadatta.parida@aveva.com?subject=Job failure - ' + @Oriserver + '(' + @ServerIP + ') '+ CONVERT(VARCHAR(15), GETDATE(), 101) +'&cc=Debadatta.parida@aveva.com&body = SD please log this call to DB support,' + '%0A %0A' + '<<' + ISNULL(CONVERT(VARCHAR(100), name),'''') + '>> Job Failed on ' + @OriServer + '(' + @ServerIP + ')'+ '.' +'%0A%0A Regards,'+'">Failed</a></font></blink></b></td>'
WHEN 1 THEN '<td><font face="Verdana" size="1">Success</font></td>'
WHEN 3 THEN '<td><font face="Verdana" size="1">Cancelled</font></td>'
WHEN 5 THEN '<td><font face="Verdana" size="1">Unknown</font></td>'
ELSE '<td><font face="Verdana" size="1">Other</font></td>'
END +
'<td><font face="Verdana" size="1">' + ISNULL(CONVERT(VARCHAR(100), A.category),'') + '</font></td>' +
'<td><font face="Verdana" size="1">' + ISNULL(CONVERT(VARCHAR(50), A.last_run_date),'') + '</font></td>' +
'<td><font face="Verdana" size="1">' + ISNULL(CONVERT(VARCHAR(50), X.execution_time_minutes),'') +'</font></td> </tr>'
FROM
#jobs_status A
inner join (
select
A.job_id, A.start_execution_date,
datediff(mi, A.last_executed_step_date, A.stop_execution_date) execution_time_minutes
from
msdb..sysjobactivity A
inner join (
select
max(session_id) sessionid,
job_id
from
msdb..sysjobactivity
group by
job_id
) B on a.job_id = B.job_id and a.session_id = b.sessionid
inner join (
select
distinct name,
job_id
from
msdb..sysjobs
) C on A.job_id = c.job_id
) X on A.job_id = X.job_id
where enabled = 1
ORDER BY
last_run_date DESC
--select * from #jobs_status
SET @TableHTML = @TableHTML +
'</table>'
--====================database details
SELECT
@TableHTML = @TableHTML +
'<p style="margin-top: 1; margin-bottom: 0"> </p>
<font face="Verdana" size="4">Databases</font>
<table id="AutoNumber1" style="BORDER-COLLAPSE: collapse" borderColor="#111111" height="40" cellSpacing="0" cellPadding="0" width="100%" border="1">
<tr>
<td width="35%" bgColor="#000080" height="15"><b>
<font face="Verdana" size="1" color="#FFFFFF">Name</font></b></td>
<td width="23%" bgColor="#000080" height="15"><b>
<font face="Verdana" size="1" color="#FFFFFF">CreatedDate</font></b></td>
<td width="23%" bgColor="#000080" height="15"><b>
<font face="Verdana" size="1" color="#FFFFFF">DB Size(GB)</font></b></td>
<td width="30%" bgColor="#000080" height="15"><b>
<font face="Verdana" size="1" color="#FFFFFF">State</font></b></td>
<td width="50%" bgColor="#000080" height="15"><b>
<font face="Verdana" size="1" color="#FFFFFF">RecoveryModel</font></b></td>
</tr>'
select
@TableHTML = @TableHTML +
'<tr><td><font face="Verdana" size="1">' + ISNULL(name, '') +'</font></td>' +
'<td><font face="Verdana" size="1">' + CONVERT(VARCHAR(2), DATEPART(dd, create_date)) + '-' + CONVERT(VARCHAR(3),DATENAME(mm,create_date)) + '-' + CONVERT(VARCHAR(4),DATEPART(yy,create_date)) +'</font></td>' +
'<td><font face="Verdana" size="1">' + ISNULL(CONVERT(VARCHAR(10), AA.[Total Size GB]), '') +'</font></td>' +
'<td><font face="Verdana" size="1">' + ISNULL(state_desc, '') +'</font></td>' +
'<td><font face="Verdana" size="1">' + ISNULL(recovery_model_desc, '') +'</font></td></tr>'
from
sys.databases MST
inner join (
--select b.name [LOG_DBNAME],
-- CONVERT(DECIMAL(10,2),sum(CONVERT(DECIMAL(10,2),(a.size * 8)) /1024)/1024) [Total Size GB]
-- from sys.sysaltfiles A
-- inner join sys.databases B on A.dbid = B.database_id
-- group by b.name
select b.name [LOG_DBNAME],
CONVERT(DECIMAL(10,2),sum(CONVERT(DECIMAL(10,2),a.size) )*8/1024/1024) [Total Size GB]
--CONVERT(DECIMAL(10,2),sum(CONVERT(DECIMAL(10,2),(a.size * 8)) /1024)) [Total Size MB]
from sys.sysaltfiles A
inner join sys.databases B
on A.dbid = B.database_id
group by b.name
)AA on AA.[LOG_DBNAME] = MST.name
order by
MST.database_id
SET @TableHTML = @TableHTML +
'</table>'
--=======================database details ends
--=======================index fragmentation
If exists (select * from tempdb.sys.all_objects where name like '#db_frag%' )
drop table #db_frag
create table #db_frag
( DatabaseName varchar(100),
ObjectName varchar(100),
indexName varchar(100),
avg_fragmentation_percent float,
page_count int,
IndexType varchar(100),
Action_Required varchar(100) default 'NA'
)
insert into #db_frag (DatabaseName,ObjectName, indexName,avg_fragmentation_percent,page_count,IndexType)
exec master.sys.sp_MSforeachdb ' USE [?]
SELECT db_name() as DatabaseName, OBJECT_NAME (a.object_id) as ObjectName,
b.name as IndexName,
avg_fragmentation_in_percent, page_count, index_type_desc
-- , record_count, avg_page_space_used_in_percent --(null in limited)
FROM sys.dm_db_index_physical_stats (db_id(), NULL, NULL, NULL, NULL) AS a
JOIN sys.indexes AS b
ON a.object_id = b.object_id AND a.index_id = b.index_id
WHERE b.index_id <> 0 and avg_fragmentation_in_percent > 70
and page_count > 1000
'
update #db_frag
set Action_Required ='Rebuild'
where avg_fragmentation_percent >30
update #db_frag
set Action_Required ='Rorganize'
where avg_fragmentation_percent <30 and avg_fragmentation_percent >10
SELECT @TableHTML = @TableHTML + '<p style="margin-top: 0; margin-bottom: 0"> </p>
<font face="Verdana" size="4">Index Fragmentation (> 70%)</font>
<table style="BORDER-COLLAPSE: collapse" borderColor="#111111" cellPadding="0" bgColor="#ffffff" borderColorLight="#000000" border="1">
<tr>
<th align="left" bgColor="#000080">
<font face="Verdana" size="1" color="#FFFFFF">Database Name</font></th>
<th align="left" bgColor="#000080">
<font face="Verdana" size="1" color="#FFFFFF">Object Name</font></th>
<th align="left" bgColor="#000080">
<font face="Verdana" size="1" color="#FFFFFF">Index Name</font></th>
<th align="left" bgColor="#000080">
<font face="Verdana" size="1" color="#FFFFFF">Avg Frag (%)</font></th>
<th align="left" bgColor="#000080">
<font face="Verdana" size="1" color="#FFFFFF">Page Count</font></th>
<th align="left" bgColor="#000080">
<font face="Verdana" size="1" color="#FFFFFF">Type</font></th>
<th align="left" bgColor="#000080">
<font face="Verdana" size="1" color="#FFFFFF">ActionRequired</font></th>
</tr>'
SELECT
@TableHTML = @TableHTML +
'<tr style="color:#F00"><td><font face="Verdana" size="1">' + ISNULL(CONVERT(VARCHAR(100), DatabaseName), '') +'</font></td>' +
'<td><font face="Verdana" size="1">' + ISNULL(CONVERT(VARCHAR(100), ObjectName), '') +'</font></td>' +
'<td><font face="Verdana" size="1">' + ISNULL(CONVERT(VARCHAR(100), indexName), '') +'</font></td>' +
'<td><font face="Verdana" size="1">' + ISNULL(CONVERT(VARCHAR(100), avg_fragmentation_percent), '') +'</font></td>' +
'<td><font face="Verdana" size="1">' + ISNULL(CONVERT(VARCHAR(100), page_count), '') +'</font></td>' +
'<td><font face="Verdana" size="1">' + ISNULL(CONVERT(VARCHAR(100), IndexType), '') +'</font></td>' +
'<td><font face="Verdana" size="1">' + ISNULL(CONVERT(VARCHAR(100), Action_Required), '') +'</font></td></tr>'
FROM
#db_frag
SELECT @TableHTML = @TableHTML + '</table>'
--=========================index fragmentation ends
--------
--=========================Mirror Status
If exists (select * from tempdb.sys.all_objects where name like '#mirror_status%' )
BEGIN
DROP TABLE #mirror_status
END
CREATE TABLE #mirror_status
(
name varchar(30),
mdbid int,
status varchar (30),
partnername varchar(50)
)
INSERT into #mirror_status(name, mdbid,[status],partnername)
SELECT DB_NAME(database_id),database_id,mirroring_state_desc,mirroring_partner_name
FROM sys.database_mirroring
WHERE mirroring_role is NOT NULL
if exists (select * from #mirror_status)
begin
SELECT
@TableHTML = @TableHTML +
'<br><font face="Verdana" size="4">Database Mirroring Status</font>
</table><table id="AutoNumber1" style="BORDER-COLLAPSE: collapse" borderColor="#111111" height="40" cellSpacing="0" cellPadding="0"
width="61%" border="1">
<tr>
<td width="15%" bgColor="#000080" height="15"><b>
<font face="Verdana" size="1" color="#FFFFFF">Database Name</font></b></td>
<td width="15%" bgColor="#000080" height="15"><b>
<font face="Verdana" size="1" color="#FFFFFF">Database ID</font></b></td>
<td width="30%" bgColor="#000080" height="15"><b>
<font face="Verdana" size="1" color="#FFFFFF">Mirror State</font></b></td>
<td width="70%" bgColor="#000080" height="15"><b>
<font face="Verdana" size="1" color="#FFFFFF">Mirror Partner Name </font></b></td>
</tr>
<p style="margin-top: 1; margin-bottom: 0"> </p>
'
SELECT
@TableHTML = @TableHTML +
'<tr><td><font face="Verdana" size="1">' + ISNULL(CONVERT(VARCHAR(100),
ms.name), '') +'</font></td>' +
'<td><font face="Verdana" size="1">' + ISNULL(CONVERT(VARCHAR(100),
ms.mdbid), '') +'</font></td>' +
'<td><font face="Verdana" size="1">' + ISNULL(CONVERT(VARCHAR(100),
ms.status), '') +'</font></td>' +
'<td><font face="Verdana" size="1">' + ISNULL(CONVERT(VARCHAR(100),
ms.partnername), '') +
+'</font></td></tr>'
FROM
#mirror_status ms
SELECT @TableHTML = @TableHTML + '</table>'
end
else
begin
SELECT
@TableHTML = @TableHTML +
'<br><p><font face="Verdana" size="4">Database Mirroring Status</font> (Mirroring not configured)</p>'
end
--============Mirror status ends
-------
--============REPLICATION status
if exists(select * from master.sys.sysservers where srvname like 'repl_distributor')
begin
If exists (select * from tempdb.sys.all_objects where name like '#replication_status%' )
BEGIN
DROP TABLE #replication_status
END
CREATE TABLE #replication_status(
[agent_name] [sysname] NOT NULL,
[PublicationType] [varchar](13) NULL,
[AgentType] [varchar](12) NULL,
[Status] [varchar](9) NULL,
[Warning] [varchar](20) NULL,
[last_distsync] [datetime] NULL,
[retention] [int] NULL,
[avg_latency] [int] NULL,
[average_runspeedPerf] [int] NULL
)
if not exists (select * from master.sys.sysservers where srvname like 'repl_distributor' and datasource like @@SERVERNAME)
begin
declare @distributor varchar(50), @cmd varchar(max)
select @distributor = datasource from master.sys.sysservers where srvname like 'repl_distributor'
print 'Distributor - ' + @distributor
set @cmd = 'SELECT agent_name, case publication_type
when 0 then ''Transactional''
when 1 then ''Snapshot''
when 2 then ''Merge''
end as PublicationType,
case agent_type
when 1 then ''Snapshot''
when 2 then ''Log Reader''
when 3 then ''Distribution''
when 4 then ''Merge''
when 9 then ''Queue Reader''
end as AgentType,
case status
when 1 then ''Started''
when 2 then ''Succeeded''
when 3 then ''Progress''
when 4 then ''Idle''
when 5 then ''Retrying''
when 6 then ''Failed''
end as Status,
when 2 then ''latency''
case warning
when 1 then ''expiration''
when 4 then ''mergeexpiration''
when 16 then ''mergeslowrunduration''
when 32 then ''mergefastrunspeed''
when 64 then ''mergeslowrunspeed''
end as Warning,
last_distsync, retention, avg_latency, average_runspeedPerf
FROM OPENROWSET(''SQLNCLI'', ''Server=' + @distributor+';Trusted_Connection=yes;'',
''select * from distribution.dbo.MSreplication_monitordata'') AS a'
insert into #replication_status
exec (@cmd)
end
else
begin
insert into #replication_status
select agent_name, case publication_type
when 0 then 'Transactional'
when 1 then 'Snapshot'
when 2 then 'Merge'
end as PublicationType,
case agent_type
when 1 then 'Snapshot'
when 2 then 'Log Reader'
when 3 then 'Distribution'
when 4 then 'Merge'
when 9 then 'Queue Reader'
end as AgentType,
case status
when 1 then 'Started'
when 2 then 'Succeeded'
when 3 then 'Progress'
when 4 then 'Idle'
when 5 then 'Retrying'
when 6 then 'Failed'
end as Status,
case warning
when 1 then 'expiration'
when 2 then 'latency'
when 4 then 'mergeexpiration'
when 16 then 'mergeslowrunduration'
when 32 then 'mergefastrunspeed'
when 64 then 'mergeslowrunspeed'
end as Warning,
last_distsync, retention, avg_latency, average_runspeedPerf
from distribution.dbo.MSreplication_monitordata
end
SELECT
@TableHTML = @TableHTML +
'<p style="margin-top: 1; margin-bottom: 0"> </p>
<font face="Verdana" size="4">Replication Statistics</font>
<table style="BORDER-COLLAPSE: collapse" borderColor="#111111" cellPadding="0" bgColor="#ffffff" borderColorLight="#000000" border="1">
<tr>
<th align="left" bgColor="#000080">
<font face="Verdana" size="1" color="#FFFFFF">AgentName</font></th>
<th align="left" bgColor="#000080">
<font face="Verdana" size="1" color="#FFFFFF">PublicationType</font></th>
<th align="left" bgColor="#000080">
<font face="Verdana" size="1" color="#FFFFFF">AgentType</font></th>
<th align="left" bgColor="#000080">
<font face="Verdana" size="1" color="#FFFFFF">Status</font></th>
<th align="left" bgColor="#000080">
<font face="Verdana" size="1" color="#FFFFFF">Warning</font></th>
<th align="left" bgColor="#000080">
<font face="Verdana" size="1" color="#FFFFFF">Last_Dist_Sync</font></th>
<th align="left" bgColor="#000080">
<font face="Verdana" size="1" color="#FFFFFF">Retention</font></th>
<th align="left" bgColor="#000080">
<font face="Verdana" size="1" color="#FFFFFF">avg_latency</font></th>
<th align="left" bgColor="#000080">
<font face="Verdana" size="1" color="#FFFFFF">average_runspeedPerf</font></th>
</tr>'
SELECT
@TableHTML = @TableHTML +
'<tr>' +
'<td><font face="Verdana" size="1">' + isnull(cast(agent_name as varchar(100)),'') +'</font></td>' +
'<td><font face="Verdana" size="1">' + isnull(cast(PublicationType as varchar(100)),'') +'</font></td>' +
'<td><font face="Verdana" size="1">' + isnull(cast(AgentType as varchar(500)),'') +'</font></td>' +
'<td><font face="Verdana" size="1">' + isnull(cast([Status] as varchar(50)),'') +'</font></td>' +
'<td><font face="Verdana" size="1">' + isnull(cast([Warning] as varchar(200)),'') +'</font></td>' +
'<td><font face="Verdana" size="1">' + isnull(cast(last_distsync as varchar(100)),'') +'</font></td>' +
'<td><font face="Verdana" size="1">' + isnull(cast([retention] as varchar(100)),'') +'</font></td>' +
'<td><font face="Verdana" size="1">' + isnull(cast(avg_latency as varchar(100)),'') +'</font></td>' +
'<td><font face="Verdana" size="1">' + isnull(cast(average_runspeedPerf as varchar(100)),'') +'</font></td>' +
'</tr>'
FROM #replication_status
SELECT
@TableHTML = @TableHTML + N'</table>'
end
else
begin
SELECT
@TableHTML = @TableHTML +
'<br><p><font face="Verdana" size="4">Replication Status</font> (Replication not configured / No publications)</p>'
end
--============replication status ends
-----------------------------
-- ======== DB Log Shipping Monitor
if exists (select * from msdb..log_shipping_monitor_primary)
begin
SELECT
@TableHTML = @TableHTML +
'<p style="margin-top: 1; margin-bottom: 0"> </p>
<font face="Verdana" size="4">Log Shipping Stats</font><br />
<font face="Verdana" size="2">Local Primaries</font>
<table style="BORDER-COLLAPSE: collapse" borderColor="#111111" cellPadding="0" bgColor="#ffffff" borderColorLight="#000000" border="1">
<tr>
<th align="left" bgColor="#000080">
<font face="Verdana" size="1" color="#FFFFFF">Instance</font></th>
<th align="left" bgColor="#000080">
<font face="Verdana" size="1" color="#FFFFFF">Database</font></th>
<th align="left" bgColor="#000080">
<font face="Verdana" size="1" color="#FFFFFF">BackupThreshold</font></th>
<th align="left" bgColor="#000080">
<font face="Verdana" size="1" color="#FFFFFF">LastBackup</font></th>
<th align="left" bgColor="#000080">
<font face="Verdana" size="1" color="#FFFFFF">LastBackupFile</font></th>
</tr>'
SELECT
@TableHTML = @TableHTML +
'<tr>' +
'<td><font face="Verdana" size="1">' + isnull(cast(primary_server as varchar(100)),'') +'</font></td>' +
'<td><font face="Verdana" size="1">' + isnull(cast(primary_database as varchar(100)),'') +'</font></td>' +
'<td><font face="Verdana" size="1">' + isnull(cast(backup_threshold as varchar(10)),'') +'</font></td>' +
'<td><font face="Verdana" size="1">' + isnull(cast(last_backup_date as varchar(50)),'') +'</font></td>' +
'<td><font face="Verdana" size="1">' + isnull(cast(last_backup_file as varchar(300)),'') +'</font></td>' +
'</tr>'
FROM msdb..log_shipping_monitor_primary
SELECT
@TableHTML = @TableHTML + N'</table>'
end
if exists (select * from msdb..log_shipping_monitor_secondary)
begin
SELECT
@TableHTML = @TableHTML +
'<p style="margin-top: 1; margin-bottom: 0"> </p>
<font face="Verdana" size="2">Local Secondaries</font>
<table style="BORDER-COLLAPSE: collapse" borderColor="#111111" cellPadding="0" bgColor="#ffffff" borderColorLight="#000000" border="1">
<tr>
<th align="left" bgColor="#000080">
<font face="Verdana" size="1" color="#FFFFFF">PrimaryInstance</font></th>
<th align="left" bgColor="#000080">
<font face="Verdana" size="1" color="#FFFFFF">SecondaryInstance</font></th>
<th align="left" bgColor="#000080">
<font face="Verdana" size="1" color="#FFFFFF">Database</font></th>
<th align="left" bgColor="#000080">
<font face="Verdana" size="1" color="#FFFFFF">RestoreThreshold</font></th>
<th align="left" bgColor="#000080">
<font face="Verdana" size="1" color="#FFFFFF">LastRestore</font></th>
<th align="left" bgColor="#000080">
<font face="Verdana" size="1" color="#FFFFFF">LastRestoredFile</font></th>
</tr>'
SELECT
@TableHTML = @TableHTML +
'<tr>' +
'<td><font face="Verdana" size="1">' + isnull(cast(primary_server as varchar(100)),'') +'</font></td>' +
'<td><font face="Verdana" size="1">' + isnull(cast(secondary_server as varchar(100)),'') +'</font></td>' +
'<td><font face="Verdana" size="1">' + isnull(cast(primary_database as varchar(100)),'') +'</font></td>' +
'<td><font face="Verdana" size="1">' + isnull(cast(restore_threshold as varchar(10)),'') +'</font></td>' +
'<td><font face="Verdana" size="1">' + isnull(cast(last_restored_date as varchar(50)),'') +'</font></td>' +
'<td><font face="Verdana" size="1">' + isnull(cast(last_restored_file as varchar(300)),'') +'</font></td>' +
'</tr>'
FROM msdb..log_shipping_monitor_secondary
SELECT
@TableHTML = @TableHTML + N'</table>'
end
-- Fetch from remote secondaries
if exists (select * from msdb..log_shipping_primary_secondaries)
begin
declare @remotesecondary sysname;
if exists (select name from tempdb..sysobjects where name like '%#remoteLSSecondaries%')
drop table #remoteLSSecondaries
select secondary_server into #remoteLSSecondaries from msdb..log_shipping_primary_secondaries
select top 1 @remotesecondary = secondary_server from #remoteLSSecondaries
while(@remotesecondary is not null)
begin
set @cmd = 'select primary_server, secondary_server,
secondary_database, restore_threshold,
last_restored_date, last_restored_file
FROM OPENROWSET(''SQLNCLI'', ''Server=' + @remotesecondary+';Trusted_Connection=yes;'',
''select * from msdb..log_shipping_monitor_secondary'') AS a'
if exists (select name from tempdb..sysobjects where name like '%#remoteLSStats%')
drop table #remoteLSStats
create table #remoteLSStats
(
primary_server sysname, secondary_server sysname,
secondary_database sysname, restore_threshold int,
last_restored_date varchar(50), last_restored_file varchar(500)
)
insert into #remoteLSStats
exec (@cmd)
delete from #remoteLSSecondaries where secondary_server = @remotesecondary
set @remotesecondary = NULL
select top 1 @remotesecondary = secondary_server from #remoteLSSecondaries
end
--select * from #remoteLSStats
SELECT
@TableHTML = @TableHTML +
'<p style="margin-top: 1; margin-bottom: 0"> </p>
<font face="Verdana" size="2">Remote Secondaries</font>
<table style="BORDER-COLLAPSE: collapse" borderColor="#111111" cellPadding="0" bgColor="#ffffff" borderColorLight="#000000" border="1">
<tr>
<th align="left" bgColor="#000080">
<font face="Verdana" size="1" color="#FFFFFF">PrimaryInstance</font></th>
<th align="left" bgColor="#000080">
<font face="Verdana" size="1" color="#FFFFFF">SecondaryInstance</font></th>
<th align="left" bgColor="#000080">
<font face="Verdana" size="1" color="#FFFFFF">Database</font></th>
<th align="left" bgColor="#000080">
<font face="Verdana" size="1" color="#FFFFFF">RestoreThreshold</font></th>
<th align="left" bgColor="#000080">
<font face="Verdana" size="1" color="#FFFFFF">LastRestore</font></th>
<th align="left" bgColor="#000080">
<font face="Verdana" size="1" color="#FFFFFF">LastRestoredFile</font></th>
</tr>'
SELECT
@TableHTML = @TableHTML +
'<tr>' +
'<td><font face="Verdana" size="1">' + isnull(cast(primary_server as varchar(100)),'') +'</font></td>' +
'<td><font face="Verdana" size="1">' + isnull(cast(secondary_server as varchar(100)),'') +'</font></td>' +
'<td><font face="Verdana" size="1">' + isnull(cast(secondary_database as varchar(100)),'') +'</font></td>' +
'<td><font face="Verdana" size="1">' + isnull(cast(restore_threshold as varchar(10)),'') +'</font></td>' +
'<td><font face="Verdana" size="1">' + isnull(cast(last_restored_date as varchar(50)),'') +'</font></td>' +
'<td><font face="Verdana" size="1">' + isnull(cast(last_restored_file as varchar(300)),'') +'</font></td>' +
'</tr>'
FROM #remoteLSStats
SELECT
@TableHTML = @TableHTML + N'</table>'
end
-- ========== DB Log shipping monitor ends
-- Code for SQL Server Database Backup Stats
SELECT
@TableHTML = @TableHTML +
'<p style="margin-top: 1; margin-bottom: 0"> </p>
<font face="Verdana" size="4">Backup Stats</font>
<table style="BORDER-COLLAPSE: collapse" borderColor="#111111" cellPadding="0" width="933" bgColor="#ffffff" borderColorLight="#000000" border="1">
<tr>
<th align="left" width="91" bgColor="#000080">
<font face="Verdana" size="1" color="#FFFFFF">Date</font></th>
<th align="left" width="105" bgColor="#000080">
<font face="Verdana" size="1" color="#FFFFFF">Database</font></th>
<th align="left" width="165" bgColor="#000080">
<font face="Verdana" size="1" color="#FFFFFF">File Name</font></th>
<th align="left" width="75" bgColor="#000080">
<font face="Verdana" size="1" color="#FFFFFF">Type</font></th>
<th align="left" width="165" bgColor="#000080">
<font face="Verdana" size="1" color="#FFFFFF">Start Time</font></th>
<th align="left" width="165" bgColor="#000080">
<font face="Verdana" size="1" color="#FFFFFF">End Time</font></th>
<th align="left" width="136" bgColor="#000080">
<font face="Verdana" size="1" color="#FFFFFF">Size(GB)</font></th>
</tr>'
SELECT
@TableHTML = @TableHTML +
'<tr>
<td><font face="Verdana" size="1">' + ISNULL(CONVERT(VARCHAR(2), DATEPART(dd,MST.backup_start_date)) + '-' + CONVERT(VARCHAR(3),DATENAME(mm, MST.backup_start_date)) + '-' + CONVERT(VARCHAR(4), DATEPART(yyyy, MST.backup_start_date)),'') +'</font></td>' +
'<td><font face="Verdana" size="1">' + ISNULL(CONVERT(VARCHAR(100), MST.database_name), '') +'</font></td>' +
'<td><font face="Verdana" size="1">' + ISNULL(CONVERT(VARCHAR(100), MST.name), '') +'</font></td>' +
CASE Type
WHEN 'D' THEN '<td><font face="Verdana" size="1">' + 'Full' +'</font></td>'
WHEN 'I' THEN '<td><font face="Verdana" size="1">' + 'Differential' +'</font></td>'
WHEN 'L' THEN '<td><font face="Verdana" size="1">' + 'Log' +'</font></td>'
WHEN 'F' THEN '<td><font face="Verdana" size="1">' + 'File or Filegroup' +'</font></td>'
WHEN 'G' THEN '<td><font face="Verdana" size="1">' + 'File Differential' +'</font></td>'
WHEN 'P' THEN '<td><font face="Verdana" size="1">' + 'Partial' +'</font></td>'
WHEN 'Q' THEN '<td><font face="Verdana" size="1">' + 'Partial Differential' +'</font></td>'
ELSE '<td><font face="Verdana" size="1">' + 'Unknown' +'</font></td>'
END +
'<td><font face="Verdana" size="1">' + ISNULL(CONVERT(VARCHAR(50), MST.backup_start_date), '') +'</font></td>' +
'<td><font face="Verdana" size="1">' + ISNULL(CONVERT(VARCHAR(50), MST.backup_finish_date), '') +'</font></td>' +
'<td><font face="Verdana" size="1">' + ISNULL(CONVERT(VARCHAR(10), CAST((MST.backup_size/1024)/1024/1024 AS DECIMAL(10,2))), '') +'</font></td>' +
'</tr>'
FROM
msdb..backupset MST
WHERE
MST.backup_start_date BETWEEN @StartDate AND @EndDate
ORDER BY
MST.backup_start_date DESC
SELECT @TableHTML = @TableHTML + '</table>'
-- Code for physical database backup file present on disk
INSERT #url
SELECT DISTINCT
SUBSTRING(BMF.physical_device_name, 1, len(BMF.physical_device_name) - CHARINDEX('\', REVERSE(BMF.physical_device_name), 0))
from
msdb..backupset MST
inner join msdb..backupmediafamily BMF ON BMF.media_set_id = MST.media_set_id
where
MST.backup_start_date BETWEEN @startdate AND @enddate
select @Cnt = COUNT(*) FROM #url
WHILE @Cnt >0
BEGIN
SELECT @URL = url FROM #url WHERE idd = @Cnt
SELECT @Str = 'EXEC master.dbo.xp_cmdshell ''dir "' + @URL +'" /B/O:D'''
INSERT #dirpaths SELECT 'PATH: ' + @URL
INSERT #dirpaths
EXEC (@Str)
INSERT #dirpaths values('')
SET @Cnt = @Cnt - 1
end
DELETE FROM #dirpaths WHERE files IS NULL
select
@TableHTML = @TableHTML +
'<p style="margin-top: 1; margin-bottom: 0"> </p>
<font face="Verdana" size="4">Physical Backup Files</font>
<table style="BORDER-COLLAPSE: collapse" borderColor="#111111" cellPadding="0" width="933" bgColor="#ffffff" borderColorLight="#000000" border="1">
<tr>
<th align="left" width="91" bgColor="#000080">
<font face="Verdana" size="1" color="#FFFFFF">Physical Files</font></th>
</tr>'
SELECT
@TableHTML = @TableHTML + '<tr>' +
CASE SUBSTRING(files, 1, 5)
WHEN 'PATH:' THEN '<td bgcolor = "#D7D7D7"><b><font face="Verdana" size="1">' + files + '</font><b></td>'
ELSE
'<td><font face="Verdana" size="1">' + files + '</font></td>'
END +
'</tr></table>'
FROM
#dirpaths
SELECT
@TableHTML = @TableHTML +
'<p style="margin-top: 0; margin-bottom: 0"> </p>
<hr color="#000000" size="1">
<!--<p><font face="Verdana" size="2"><b>Server Owner:</b> '+@owner+'</font></p> -->
<p style="margin-top: 0; margin-bottom: 0"><font face="Verdana" size="2">Thanks
and Regards,</font></p>
<p style="margin-top: 0; margin-bottom: 0"><font face="Verdana" size="2">DB
Support Team</font></p>
<p> </p>'
EXEC msdb.dbo.sp_send_dbmail
@profile_name = @MailProfile,
@recipients=@Recepients,
@subject = @strSubject,
@body = @TableHTML,
@body_format = 'HTML' ;
--print @TableHTML
SET NOCOUNT OFF
Changes for All Drive details
DECLARE @ServerIP VARCHAR(100), @Project VARCHAR(100),
@Recepients VARCHAR(2000), @MailProfile VARCHAR(100),
@Owner VARCHAR(200)
SET @ServerIP = '.' -- SQL Server 2012 Database Server IP Address
set @Project = 'Aveva' -- Name of project or client
set @Recepients = 'debadatta.parida@aveva.com' -- Recepient(s) of this email (; separated in case of multiple recepients).
set @MailProfile = 'Dev' -- Mail profile name which exists on the target database server
set @Owner = 'Debadatta'
SET NOCOUNT ON
/* Drop all the temp tables(not necessary at all as local temp tables get dropped as soon as session is released,
however, good to follow this practice). */
If exists (select * from tempdb.sys.all_objects where name like '#jobs_status%' )
BEGIN
DROP TABLE #jobs_status
END
If exists (select * from tempdb.sys.all_objects where name like '#diskspace%' )
BEGIN
DROP TABLE #diskspace
END
If exists (select * from tempdb.sys.all_objects where name like '#url%' )
BEGIN
DROP TABLE #url
END
If exists (select * from tempdb.sys.all_objects where name like '#dirpaths%' )
BEGIN
DROP TABLE #dirpaths
END
-- Create the temp tables which will be used to hold the data.
CREATE TABLE #url
(
idd INT IDENTITY (1,1),
url VARCHAR(1000)
)
CREATE TABLE #dirpaths
(
files VARCHAR(2000)
)
If exists (select * from tempdb.sys.all_objects where name like '#drives%' )
BEGIN
DROP TABLE #drives
End
DECLARE @hr int
DECLARE @fso int
DECLARE @drive char(1)
DECLARE @odrive int
DECLARE @TotalSize varchar(20) DECLARE @MB Numeric ; SET @MB = 1048576
CREATE TABLE #drives (drive char(1) PRIMARY KEY, FreeSpace int NULL,
TotalSize int NULL) INSERT #drives(drive,FreeSpace) EXEC
master.dbo.xp_fixeddrives EXEC @hr=sp_OACreate
'Scripting.FileSystemObject',@fso OUT IF @hr <> 0 EXEC sp_OAGetErrorInfo
@fso
DECLARE dcur CURSOR LOCAL FAST_FORWARD
FOR SELECT drive from #drives ORDER by drive
OPEN dcur FETCH NEXT FROM dcur INTO @drive
WHILE @@FETCH_STATUS=0
BEGIN
EXEC @hr = sp_OAMethod @fso,'GetDrive', @odrive OUT, @drive
IF @hr <> 0 EXEC sp_OAGetErrorInfo @fso EXEC @hr =
sp_OAGetProperty
@odrive,'TotalSize', @TotalSize OUT IF @hr <> 0 EXEC sp_OAGetErrorInfo
@odrive UPDATE #drives SET TotalSize=@TotalSize/@MB WHERE
drive=@drive FETCH NEXT FROM dcur INTO @drive
End
Close dcur
DEALLOCATE dcur
EXEC @hr=sp_OADestroy @fso IF @hr <> 0 EXEC sp_OAGetErrorInfo @fso
select sj.job_id, sj.name, sc.name as Category, sj.Enabled, sjs.last_run_outcome,
(SELECT top 1 endTime = CONVERT
( DATETIME, RTRIM(run_date)) + ( run_time * 9 + run_time % 10000 * 6 + run_time % 100 * 10 + 25 * run_duration) / 216e4
FROM msdb..sysjobhistory sjh where sjh.job_id = sj.job_id order by run_date desc, run_time desc) as last_run_date
into #jobs_status
from msdb..sysjobs sj
join msdb..syscategories sc
on sj.category_id = sc.category_id
join msdb.dbo.sysjobservers sjs
on sjs.job_id = sj.job_id
-- Variable declaration
DECLARE @TableHTML VARCHAR(MAX),
@StrSubject VARCHAR(100),
@Oriserver VARCHAR(100),
@Version VARCHAR(250),
@Edition VARCHAR(100),
@ISClustered VARCHAR(100),
@SP VARCHAR(100),
@ServerCollation VARCHAR(100),
@SingleUser VARCHAR(5),
@LicenseType VARCHAR(100),
@StartDate DATETIME,
@EndDate DATETIME,
@Cnt int,
@URL varchar(1000),
@Str varchar(1000)
-- Variable Assignment
SELECT @Version = @@version
SELECT @Edition = CONVERT(VARCHAR(100), serverproperty('Edition'))
--SELECT @StartDate = CAST(CONVERT(VARCHAR(4), DATEPART(yyyy, GETDATE())) + '-' + CONVERT(VARCHAR(2), DATEPART(mm, GETDATE())) + '-01' AS DATETIME)
-- SELECT @StartDate = @StartDate - 1
SELECT @StartDate = getdate()-1
SELECT @EndDate = CAST(CONVERT(VARCHAR(5),DATEPART(yyyy, GETDATE() + 1)) + '-' + CONVERT(VARCHAR(2),DATEPART(mm, GETDATE() + 1)) + '-' + CONVERT(VARCHAR(2), DATEPART(dd, GETDATE() + 1)) AS DATETIME)
SET @Cnt = 0
IF serverproperty('IsClustered') = 0
BEGIN
SELECT @ISClustered = 'No'
END
ELSE
BEGIN
SELECT @ISClustered = 'YES'
END
SELECT @SP = CONVERT(VARCHAR(100), SERVERPROPERTY ('productlevel'))
SELECT @ServerCollation = CONVERT(VARCHAR(100), SERVERPROPERTY ('Collation'))
SELECT @LicenseType = CONVERT(VARCHAR(100), SERVERPROPERTY ('LicenseType'))
SELECT @SingleUser = CASE SERVERPROPERTY ('IsSingleUser')
WHEN 1 THEN 'Yes'
WHEN 0 THEN 'No'
ELSE
'null' END
SELECT @OriServer = CONVERT(VARCHAR(50), SERVERPROPERTY('computernamephysicalnetbios'))
SELECT @strSubject = 'Daily Health Check Report - '+convert(varchar(20),getdate(),100) +' - ('+ CONVERT(VARCHAR(50), SERVERPROPERTY('servername')) + ')'
SET @TableHTML =
'<font face="Verdana" size="4">Server Info</font>
<table border="1" cellpadding="0" cellspacing="0" width="75%" style="border-collapse: collapse" bordercolor="#111111" id="AutoNumber1">
<tr>
<td bgcolor="#000080"><b>
<font face="Verdana" size="2" color="#FFFFFF">Server Name</font></b></td>
<td bgcolor="#000080"><b>
<font face="Verdana" size="2" color="#FFFFFF">Instance Name</font></b></td>
<td bgcolor="#000080"><b>
<font face="Verdana" size="2" color="#FFFFFF">Edition</font></b></td>
<td width="60%" bgcolor="#000080"><b>
<font face="Verdana" size="2" color="#FFFFFF">Version</font></b></td>
<td bgcolor="#000080"><b>
<font face="Verdana" size="2" color="#FFFFFF">IsClustered</font></b></td>
</tr>
<tr>
<td><font face="Verdana" size="2">' + @OriServer +'</font></td>
<td><font face="Verdana" size="2">' + @@servername +'</font></td>
<td><font face="Verdana" size="2">' + @edition +'</font></td>
<td><font face="Verdana" size="2">' + @version +'</font></td>
<td><font face="Verdana" size="2">' + @isclustered +'</font></td>
</tr>
</table>'
SELECT
@TableHTML = @TableHTML +
'<p style="margin-top: 1; margin-bottom: 0"> </p>
<font face="Verdana" size="4">Disk Stats</font>
<table id="AutoNumber1" style="BORDER-COLLAPSE: collapse" borderColor="#111111" height="40" cellSpacing="0" cellPadding="0" width="75%" border="1">
<tr>
<td bgColor="#000080" height="15"><b>
<font face="Verdana" size="1" color="#FFFFFF">Drive</font></b></td>
<td bgColor="#000080" height="15"><b>
<font face="Verdana" size="1" color="#FFFFFF">Total Space (GB)</font></b></td>
<td bgColor="#000080" height="15"><b>
<font face="Verdana" size="1" color="#FFFFFF">Free Space (GB)</font></b></td>
<td bgColor="#000080" height="15"><b>
<font face="Verdana" size="1" color="#FFFFFF">Free Space (%)</font></b></td>
</tr>'
SELECT
@TableHTML = @TableHTML +
'<tr><td><font face="Verdana" size="1">' + ISNULL(CONVERT(VARCHAR(100), drive), '') +'</font></td>' +
'<td><font face="Verdana" size="1">' + ISNULL(CONVERT(VARCHAR(100), convert(decimal,TotalSize/1024)), '') +'</font></td>' +
'<td><font face="Verdana" size="1">' + ISNULL(CONVERT(VARCHAR(100), CONVERT(decimal,FreeSpace/1024)), '') +'</font></td>' +
'<td'+case when cast(CONVERT(decimal,FreeSpace/1024)/convert(decimal,TotalSize/1024)*100 as decimal(38,2)) < 15.00 then ' style="background-color:#F00;"' else ' style="background-color:#0F0;"' end +'><font face="Verdana" size="1">' + ISNULL(CONVERT(VARCHAR(100), cast(CONVERT(decimal,FreeSpace/1024)/convert(decimal,TotalSize/1024)*100 as decimal(38,2))), '') +'</font></td></tr>'
FROM #drives
SELECT @TableHTML = @TableHTML + '</table>'
--========================---CPU stats
If exists (select * from tempdb.sys.all_objects where name like '#cpu_usage%' )
drop table #cpu_usage
declare @ts_now bigint
select @ts_now = ms_ticks from sys.dm_os_sys_info
select dateadd (ms, (y.[timestamp] -@ts_now), GETDATE()) as EventTime,SQLProcessUtilization,SystemIdle, 100 - SystemIdle - SQLProcessUtilization as OtherProcessUtilization
into #cpu_usage
from ( select record.value('(./Record/@id)[1]', 'int') as record_id,
record.value('(./Record/SchedulerMonitorEvent/SystemHealth/SystemIdle)[1]', 'int')
as SystemIdle, record.value('(./Record/SchedulerMonitorEvent/SystemHealth/ProcessUtilization)[1]',
'int') as SQLProcessUtilization,
timestamp from ( select timestamp, convert(xml, record) as record from sys.dm_os_ring_buffers
where ring_buffer_type = N'RING_BUFFER_SCHEDULER_MONITOR'
and record like '%<SystemHealth>%') as x
) as y
order by record_id desc
--select * from #cpu_usage order by SQLProcessUtilization desc
SELECT @TableHTML = @TableHTML + '<p style="margin-top: 0; margin-bottom: 0"> </p>
<font face="Verdana" size="4">CPU Usage (%)</font>
<table style="BORDER-COLLAPSE: collapse" borderColor="#111111" width="75%" cellPadding="0" bgColor="#ffffff" borderColorLight="#000000" border="1">
<tr>
<th align="left" bgColor="#000080">
<font face="Verdana" size="1" color="#FFFFFF">EventTime</font></th>
<th align="left" bgColor="#000080">
<font face="Verdana" size="1" color="#FFFFFF">SQLProcessUtilization</font></th>
<th align="left" bgColor="#000080">
<font face="Verdana" size="1" color="#FFFFFF">SystemIdle</font></th>
<th align="left" bgColor="#000080">
<font face="Verdana" size="1" color="#FFFFFF">OtherProcessUtilization</font></th>
</tr>'
SELECT top 10
@TableHTML = @TableHTML +
'<tr><td><font face="Verdana" size="1">' + ISNULL(CONVERT(VARCHAR(100), EventTime), '') +'</font></td>' +
'<td'+case when SQLProcessUtilization > 80 then ' style="background-color:#F00;"' else ' style="background-color:#0F0;"' end +'><font face="Verdana" size="1">' + ISNULL(CONVERT(VARCHAR(100), SQLProcessUtilization), '') +'</font></td>' +
'<td><font face="Verdana" size="1">' + ISNULL(CONVERT(VARCHAR(100), SystemIdle), '') +'</font></td>' +
'<td><font face="Verdana" size="1">' + ISNULL(CONVERT(VARCHAR(100), OtherProcessUtilization), '') +'</font></td></tr>'
FROM
#cpu_usage order by SQLProcessUtilization desc
SELECT @TableHTML = @TableHTML + '</table>'
--================cpu stats ends
--===============memory stats
If exists (select * from tempdb.sys.all_objects where name like '#memory_stats%' )
drop table #memory_stats
select
total_physical_memory_kb/1024 AS [Total physical Memory MB],
available_physical_memory_kb/1024 AS [Available Physical Memory MB],
total_page_file_kb/1024 AS [Total Page File MB],
available_page_file_kb/1024 AS [Available Page File MB],
cast(100 - (100 * CAST(available_physical_memory_kb AS DECIMAL(18,3))/CAST(total_physical_memory_kb AS DECIMAL(18,3))) as decimal(18,2))
AS 'Percentage Used',
system_memory_state_desc
into #memory_stats
from sys.dm_os_sys_memory;
SELECT @TableHTML = @TableHTML + '<p style="margin-top: 0; margin-bottom: 0"> </p>
<font face="Verdana" size="4">Memory Usage</font>
<table style="BORDER-COLLAPSE: collapse" borderColor="#111111" width="75%" cellPadding="0" bgColor="#ffffff" borderColorLight="#000000" border="1">
<tr>
<th align="left" bgColor="#000080">
<font face="Verdana" size="1" color="#FFFFFF">Total physical Memory MB</font></th>
<th align="left" bgColor="#000080">
<font face="Verdana" size="1" color="#FFFFFF">Available Physical Memory MB</font></th>
<th align="left" bgColor="#000080">
<font face="Verdana" size="1" color="#FFFFFF">Total Page File MB</font></th>
<th align="left" bgColor="#000080">
<font face="Verdana" size="1" color="#FFFFFF">Available Page File MB</font></th>
<th align="left" bgColor="#000080">
<font face="Verdana" size="1" color="#FFFFFF">Percentage Used</font></th>
<th align="left" bgColor="#000080">
<font face="Verdana" size="1" color="#FFFFFF">Comments</font></th>
</tr>'
SELECT
@TableHTML = @TableHTML +
'<tr><td><font face="Verdana" size="1">' + ISNULL(CONVERT(VARCHAR(100), [Total physical Memory MB]), '') +'</font></td>' +
'<td><font face="Verdana" size="1">' + ISNULL(CONVERT(VARCHAR(100), [Available Physical Memory MB]), '') +'</font></td>' +
'<td><font face="Verdana" size="1">' + ISNULL(CONVERT(VARCHAR(100), [Total Page File MB]), '') +'</font></td>' +
'<td><font face="Verdana" size="1">' + ISNULL(CONVERT(VARCHAR(100), [Available Page File MB]), '') +'</font></td>' +
'<td><font face="Verdana" size="1">' + ISNULL(CONVERT(VARCHAR(100), [Percentage Used]), '') +'</font></td>' +
'<td><font face="Verdana" size="1">' + ISNULL(CONVERT(VARCHAR(100), system_memory_state_desc), '') +'</font></td></tr>'
FROM
#memory_stats
SELECT @TableHTML = @TableHTML + '</table>'
--===============memory stats ends
SELECT @TableHTML = @TableHTML + '<p style="margin-top: 0; margin-bottom: 0"> </p>
<font face="Verdana" size="4">Job Status</font>
<table style="BORDER-COLLAPSE: collapse" borderColor="#111111" cellPadding="0" width="75%" bgColor="#ffffff" borderColorLight="#000000" border="1">
<tr>
<th align="left" width="432" bgColor="#000080">
<font face="Verdana" size="1" color="#FFFFFF">Job Name</font></th>
<th align="left" width="85" bgColor="#000080">
<font face="Verdana" size="1" color="#FFFFFF">Last Run</font></th>
<th align="left" width="183" bgColor="#000080">
<font face="Verdana" size="1" color="#FFFFFF">Category</font></th>
<th align="left" width="136" bgColor="#000080">
<font face="Verdana" size="1" color="#FFFFFF">Last Run Date</font></th>
<th align="left" width="136" bgColor="#000080">
<font face="Verdana" size="1" color="#FFFFFF">Execution Time (Mi)</font></th>
</tr>'
SELECT
@TableHTML = @TableHTML + '<tr><td><font face="Verdana" size="1">' +
ISNULL(CONVERT(VARCHAR(100), A.name), '') +'</font></td>' +
CASE last_run_outcome
WHEN 0 THEN '<td bgColor="#ff0000"><b><blink><font face="Verdana" size="2">
<a href="mailto:Debadatta.parida@aveva.com?subject=Job failure - ' + @Oriserver + '(' + @ServerIP + ') '+ CONVERT(VARCHAR(15), GETDATE(), 101) +'&cc=Debadatta.parida@aveva.com&body = SD please log this call to DB support,' + '%0A %0A' + '<<' + ISNULL(CONVERT(VARCHAR(100), name),'''') + '>> Job Failed on ' + @OriServer + '(' + @ServerIP + ')'+ '.' +'%0A%0A Regards,'+'">Failed</a></font></blink></b></td>'
WHEN 1 THEN '<td><font face="Verdana" size="1">Success</font></td>'
WHEN 3 THEN '<td><font face="Verdana" size="1">Cancelled</font></td>'
WHEN 5 THEN '<td><font face="Verdana" size="1">Unknown</font></td>'
ELSE '<td><font face="Verdana" size="1">Other</font></td>'
END +
'<td><font face="Verdana" size="1">' + ISNULL(CONVERT(VARCHAR(100), A.category),'') + '</font></td>' +
'<td><font face="Verdana" size="1">' + ISNULL(CONVERT(VARCHAR(50), A.last_run_date),'') + '</font></td>' +
'<td><font face="Verdana" size="1">' + ISNULL(CONVERT(VARCHAR(50), X.execution_time_minutes),'') +'</font></td> </tr>'
FROM
#jobs_status A
inner join (
select
A.job_id, A.start_execution_date,
datediff(mi, A.last_executed_step_date, A.stop_execution_date) execution_time_minutes
from
msdb..sysjobactivity A
inner join (
select
max(session_id) sessionid,
job_id
from
msdb..sysjobactivity
group by
job_id
) B on a.job_id = B.job_id and a.session_id = b.sessionid
inner join (
select
distinct name,
job_id
from
msdb..sysjobs
) C on A.job_id = c.job_id
) X on A.job_id = X.job_id
where enabled = 1
ORDER BY
last_run_date DESC
--select * from #jobs_status
SET @TableHTML = @TableHTML +
'</table>'
--====================database details
SELECT
@TableHTML = @TableHTML +
'<p style="margin-top: 1; margin-bottom: 0"> </p>
<font face="Verdana" size="4">Databases</font>
<table id="AutoNumber1" style="BORDER-COLLAPSE: collapse" borderColor="#111111" height="40" cellSpacing="0" cellPadding="0" width="75%" border="1">
<tr>
<td width="35%" bgColor="#000080" height="15"><b>
<font face="Verdana" size="1" color="#FFFFFF">Name</font></b></td>
<td width="23%" bgColor="#000080" height="15"><b>
<font face="Verdana" size="1" color="#FFFFFF">CreatedDate</font></b></td>
<td width="23%" bgColor="#000080" height="15"><b>
<font face="Verdana" size="1" color="#FFFFFF">DB Size(GB)</font></b></td>
<td width="30%" bgColor="#000080" height="15"><b>
<font face="Verdana" size="1" color="#FFFFFF">State</font></b></td>
<td width="50%" bgColor="#000080" height="15"><b>
<font face="Verdana" size="1" color="#FFFFFF">RecoveryModel</font></b></td>
</tr>'
select
@TableHTML = @TableHTML +
'<tr><td><font face="Verdana" size="1">' + ISNULL(name, '') +'</font></td>' +
'<td><font face="Verdana" size="1">' + CONVERT(VARCHAR(2), DATEPART(dd, create_date)) + '-' + CONVERT(VARCHAR(3),DATENAME(mm,create_date)) + '-' + CONVERT(VARCHAR(4),DATEPART(yy,create_date)) +'</font></td>' +
'<td><font face="Verdana" size="1">' + ISNULL(CONVERT(VARCHAR(10), AA.[Total Size GB]), '') +'</font></td>' +
'<td><font face="Verdana" size="1">' + ISNULL(state_desc, '') +'</font></td>' +
'<td><font face="Verdana" size="1">' + ISNULL(recovery_model_desc, '') +'</font></td></tr>'
from
sys.databases MST
inner join (
--select b.name [LOG_DBNAME],
-- CONVERT(DECIMAL(10,2),sum(CONVERT(DECIMAL(10,2),(a.size * 8)) /1024)/1024) [Total Size GB]
-- from sys.sysaltfiles A
-- inner join sys.databases B on A.dbid = B.database_id
-- group by b.name
select b.name [LOG_DBNAME],
CONVERT(DECIMAL(10,2),sum(CONVERT(DECIMAL(10,2),a.size) )*8/1024/1024) [Total Size GB]
--CONVERT(DECIMAL(10,2),sum(CONVERT(DECIMAL(10,2),(a.size * 8)) /1024)) [Total Size MB]
from sys.sysaltfiles A
inner join sys.databases B
on A.dbid = B.database_id
group by b.name
)AA on AA.[LOG_DBNAME] = MST.name
order by
MST.database_id
SET @TableHTML = @TableHTML +
'</table>'
--=======================database details ends
--=======================index fragmentation
If exists (select * from tempdb.sys.all_objects where name like '#db_frag%' )
drop table #db_frag
create table #db_frag
( DatabaseName varchar(100),
ObjectName varchar(100),
indexName varchar(100),
avg_fragmentation_percent float,
page_count int,
IndexType varchar(100),
Action_Required varchar(100) default 'NA'
)
insert into #db_frag (DatabaseName,ObjectName, indexName,avg_fragmentation_percent,page_count,IndexType)
exec master.sys.sp_MSforeachdb ' USE [?]
SELECT db_name() as DatabaseName, OBJECT_NAME (a.object_id) as ObjectName,
b.name as IndexName,
avg_fragmentation_in_percent, page_count, index_type_desc
-- , record_count, avg_page_space_used_in_percent --(null in limited)
FROM sys.dm_db_index_physical_stats (db_id(), NULL, NULL, NULL, NULL) AS a
JOIN sys.indexes AS b
ON a.object_id = b.object_id AND a.index_id = b.index_id
WHERE b.index_id <> 0 and avg_fragmentation_in_percent > 70
and page_count > 5
'
update #db_frag
set Action_Required ='Rebuild'
where avg_fragmentation_percent >30
update #db_frag
set Action_Required ='Rorganize'
where avg_fragmentation_percent <30 and avg_fragmentation_percent >10
SELECT @TableHTML = @TableHTML + '<p style="margin-top: 0; margin-bottom: 0"> </p>
<font face="Verdana" size="4">Index Fragmentation (> 70%)</font>
<table style="BORDER-COLLAPSE: collapse" borderColor="#111111" width="75%" cellPadding="0" bgColor="#ffffff" borderColorLight="#000000" border="1">
<tr>
<th align="left" bgColor="#000080">
<font face="Verdana" size="1" color="#FFFFFF">Database Name</font></th>
<th align="left" bgColor="#000080">
<font face="Verdana" size="1" color="#FFFFFF">Object Name</font></th>
<th align="left" bgColor="#000080">
<font face="Verdana" size="1" color="#FFFFFF">Index Name</font></th>
<th align="left" bgColor="#000080">
<font face="Verdana" size="1" color="#FFFFFF">Avg Frag (%)</font></th>
<th align="left" bgColor="#000080">
<font face="Verdana" size="1" color="#FFFFFF">Page Count</font></th>
<th align="left" bgColor="#000080">
<font face="Verdana" size="1" color="#FFFFFF">Type</font></th>
<th align="left" bgColor="#000080">
<font face="Verdana" size="1" color="#FFFFFF">ActionRequired</font></th>
</tr>'
SELECT
@TableHTML = @TableHTML +
'<tr style="color:#F00"><td><font face="Verdana" size="1">' + ISNULL(CONVERT(VARCHAR(100), DatabaseName), '') +'</font></td>' +
'<td><font face="Verdana" size="1">' + ISNULL(CONVERT(VARCHAR(100), ObjectName), '') +'</font></td>' +
'<td><font face="Verdana" size="1">' + ISNULL(CONVERT(VARCHAR(100), indexName), '') +'</font></td>' +
'<td><font face="Verdana" size="1">' + ISNULL(CONVERT(VARCHAR(100), avg_fragmentation_percent), '') +'</font></td>' +
'<td><font face="Verdana" size="1">' + ISNULL(CONVERT(VARCHAR(100), page_count), '') +'</font></td>' +
'<td><font face="Verdana" size="1">' + ISNULL(CONVERT(VARCHAR(100), IndexType), '') +'</font></td>' +
'<td><font face="Verdana" size="1">' + ISNULL(CONVERT(VARCHAR(100), Action_Required), '') +'</font></td></tr>'
FROM
#db_frag
SELECT @TableHTML = @TableHTML + '</table>'
--=========================index fragmentation ends
-- Code for SQL Server Database Backup Stats
SELECT
@TableHTML = @TableHTML +
'<p style="margin-top: 1; margin-bottom: 0"> </p>
<font face="Verdana" size="4">Backup Stats</font>
<table style="BORDER-COLLAPSE: collapse" borderColor="#111111" cellPadding="0" width="75%" bgColor="#ffffff" borderColorLight="#000000" border="1">
<tr>
<th align="left" width="91" bgColor="#000080">
<font face="Verdana" size="1" color="#FFFFFF">Date</font></th>
<th align="left" width="105" bgColor="#000080">
<font face="Verdana" size="1" color="#FFFFFF">Database</font></th>
<th align="left" width="165" bgColor="#000080">
<font face="Verdana" size="1" color="#FFFFFF">File Name</font></th>
<th align="left" width="75" bgColor="#000080">
<font face="Verdana" size="1" color="#FFFFFF">Type</font></th>
<th align="left" width="165" bgColor="#000080">
<font face="Verdana" size="1" color="#FFFFFF">Start Time</font></th>
<th align="left" width="165" bgColor="#000080">
<font face="Verdana" size="1" color="#FFFFFF">End Time</font></th>
<th align="left" width="136" bgColor="#000080">
<font face="Verdana" size="1" color="#FFFFFF">Size(GB)</font></th>
</tr>'
SELECT
@TableHTML = @TableHTML +
'<tr>
<td><font face="Verdana" size="1">' + ISNULL(CONVERT(VARCHAR(2), DATEPART(dd,MST.backup_start_date)) + '-' + CONVERT(VARCHAR(3),DATENAME(mm, MST.backup_start_date)) + '-' + CONVERT(VARCHAR(4), DATEPART(yyyy, MST.backup_start_date)),'') +'</font></td>' +
'<td><font face="Verdana" size="1">' + ISNULL(CONVERT(VARCHAR(100), MST.database_name), '') +'</font></td>' +
'<td><font face="Verdana" size="1">' + ISNULL(CONVERT(VARCHAR(100), MST.name), '') +'</font></td>' +
CASE Type
WHEN 'D' THEN '<td><font face="Verdana" size="1">' + 'Full' +'</font></td>'
WHEN 'I' THEN '<td><font face="Verdana" size="1">' + 'Differential' +'</font></td>'
WHEN 'L' THEN '<td><font face="Verdana" size="1">' + 'Log' +'</font></td>'
WHEN 'F' THEN '<td><font face="Verdana" size="1">' + 'File or Filegroup' +'</font></td>'
WHEN 'G' THEN '<td><font face="Verdana" size="1">' + 'File Differential' +'</font></td>'
WHEN 'P' THEN '<td><font face="Verdana" size="1">' + 'Partial' +'</font></td>'
WHEN 'Q' THEN '<td><font face="Verdana" size="1">' + 'Partial Differential' +'</font></td>'
ELSE '<td><font face="Verdana" size="1">' + 'Unknown' +'</font></td>'
END +
'<td><font face="Verdana" size="1">' + ISNULL(CONVERT(VARCHAR(50), MST.backup_start_date), '') +'</font></td>' +
'<td><font face="Verdana" size="1">' + ISNULL(CONVERT(VARCHAR(50), MST.backup_finish_date), '') +'</font></td>' +
'<td><font face="Verdana" size="1">' + ISNULL(CONVERT(VARCHAR(10), CAST((MST.backup_size/1024)/1024/1024 AS DECIMAL(10,2))), '') +'</font></td>' +
'</tr>'
FROM
msdb..backupset MST
WHERE
MST.backup_start_date BETWEEN @StartDate AND @EndDate
ORDER BY
MST.backup_start_date DESC
SELECT @TableHTML = @TableHTML + '</table>'
-- Code for physical database backup file present on disk
INSERT #url
SELECT DISTINCT
SUBSTRING(BMF.physical_device_name, 1, len(BMF.physical_device_name) - CHARINDEX('\', REVERSE(BMF.physical_device_name), 0))
from
msdb..backupset MST
inner join msdb..backupmediafamily BMF ON BMF.media_set_id = MST.media_set_id
where
MST.backup_start_date BETWEEN @startdate AND @enddate
select @Cnt = COUNT(*) FROM #url
WHILE @Cnt >0
BEGIN
SELECT @URL = url FROM #url WHERE idd = @Cnt
SELECT @Str = 'EXEC master.dbo.xp_cmdshell ''dir "' + @URL +'" /B/O:D'''
INSERT #dirpaths SELECT 'PATH: ' + @URL
INSERT #dirpaths
EXEC (@Str)
INSERT #dirpaths values('')
SET @Cnt = @Cnt - 1
end
DELETE FROM #dirpaths WHERE files IS NULL
--select
--@TableHTML = @TableHTML +
--'<p style="margin-top: 1; margin-bottom: 0"> </p>
--<font face="Verdana" size="4">Physical Backup Files</font>
--<table style="BORDER-COLLAPSE: collapse" borderColor="#111111" cellPadding="0" width="933" bgColor="#ffffff" borderColorLight="#000000" border="1">
--<tr>
--<th align="left" width="91" bgColor="#000080">
--<font face="Verdana" size="1" color="#FFFFFF">Physical Files</font></th>
--</tr>'
--SELECT
--@TableHTML = @TableHTML + '<tr>' +
--CASE SUBSTRING(files, 1, 5)
--WHEN 'PATH:' THEN '<td bgcolor = "#D7D7D7"><b><font face="Verdana" size="1">' + files + '</font><b></td>'
--ELSE
--'<td><font face="Verdana" size="1">' + files + '</font></td>'
--END +
--'</tr></table>'
--FROM
--#dirpaths
--=========================Mirror Status
If exists (select * from tempdb.sys.all_objects where name like '#mirror_status%' )
BEGIN
DROP TABLE #mirror_status
END
CREATE TABLE #mirror_status
(
name varchar(30),
mdbid int,
status varchar (30),
partnername varchar(50)
)
INSERT into #mirror_status(name, mdbid,[status],partnername)
SELECT DB_NAME(database_id),database_id,mirroring_state_desc,mirroring_partner_name
FROM sys.database_mirroring
WHERE mirroring_role is NOT NULL
if exists (select * from #mirror_status)
begin
SELECT
@TableHTML = @TableHTML +
'<br><font face="Verdana" size="4">Database Mirroring Status</font>
</table><table id="AutoNumber1" style="BORDER-COLLAPSE: collapse" borderColor="#111111" height="40" cellSpacing="0" cellPadding="0"
width="75%" border="1">
<tr>
<td width="15%" bgColor="#000080" height="15"><b>
<font face="Verdana" size="1" color="#FFFFFF">Database Name</font></b></td>
<td width="15%" bgColor="#000080" height="15"><b>
<font face="Verdana" size="1" color="#FFFFFF">Database ID</font></b></td>
<td width="30%" bgColor="#000080" height="15"><b>
<font face="Verdana" size="1" color="#FFFFFF">Mirror State</font></b></td>
<td width="70%" bgColor="#000080" height="15"><b>
<font face="Verdana" size="1" color="#FFFFFF">Mirror Partner Name </font></b></td>
</tr>
<p style="margin-top: 1; margin-bottom: 0"> </p>
'
SELECT
@TableHTML = @TableHTML +
'<tr><td><font face="Verdana" size="1">' + ISNULL(CONVERT(VARCHAR(100),
ms.name), '') +'</font></td>' +
'<td><font face="Verdana" size="1">' + ISNULL(CONVERT(VARCHAR(100),
ms.mdbid), '') +'</font></td>' +
'<td><font face="Verdana" size="1">' + ISNULL(CONVERT(VARCHAR(100),
ms.status), '') +'</font></td>' +
'<td><font face="Verdana" size="1">' + ISNULL(CONVERT(VARCHAR(100),
ms.partnername), '') +
+'</font></td></tr>'
FROM
#mirror_status ms
SELECT @TableHTML = @TableHTML + '</table>'
end
else
begin
SELECT
@TableHTML = @TableHTML +
'<br><p><font face="Verdana" size="4">Database Mirroring Status</font> (Mirroring not configured)</p>'
end
--============Mirror status ends
-------
--============REPLICATION status
if exists(select * from master.sys.sysservers where srvname like 'repl_distributor')
begin
If exists (select * from tempdb.sys.all_objects where name like '#replication_status%' )
BEGIN
DROP TABLE #replication_status
END
CREATE TABLE #replication_status(
[agent_name] [sysname] NOT NULL,
[PublicationType] [varchar](13) NULL,
[AgentType] [varchar](12) NULL,
[Status] [varchar](9) NULL,
[Warning] [varchar](20) NULL,
[last_distsync] [datetime] NULL,
[retention] [int] NULL,
[avg_latency] [int] NULL,
[average_runspeedPerf] [int] NULL
)
if not exists (select * from master.sys.sysservers where srvname like 'repl_distributor' and datasource like @@SERVERNAME)
begin
declare @distributor varchar(50), @cmd varchar(max)
select @distributor = datasource from master.sys.sysservers where srvname like 'repl_distributor'
print 'Distributor - ' + @distributor
set @cmd = 'SELECT agent_name, case publication_type
when 0 then ''Transactional''
when 1 then ''Snapshot''
when 2 then ''Merge''
end as PublicationType,
case agent_type
when 1 then ''Snapshot''
when 2 then ''Log Reader''
when 3 then ''Distribution''
when 4 then ''Merge''
when 9 then ''Queue Reader''
end as AgentType,
case status
when 1 then ''Started''
when 2 then ''Succeeded''
when 3 then ''Progress''
when 4 then ''Idle''
when 5 then ''Retrying''
when 6 then ''Failed''
end as Status,
when 2 then ''latency''
case warning
when 1 then ''expiration''
when 4 then ''mergeexpiration''
when 16 then ''mergeslowrunduration''
when 32 then ''mergefastrunspeed''
when 64 then ''mergeslowrunspeed''
end as Warning,
last_distsync, retention, avg_latency, average_runspeedPerf
FROM OPENROWSET(''SQLNCLI'', ''Server=' + @distributor+';Trusted_Connection=yes;'',
''select * from distribution.dbo.MSreplication_monitordata'') AS a'
insert into #replication_status
exec (@cmd)
end
else
begin
insert into #replication_status
select agent_name, case publication_type
when 0 then 'Transactional'
when 1 then 'Snapshot'
when 2 then 'Merge'
end as PublicationType,
case agent_type
when 1 then 'Snapshot'
when 2 then 'Log Reader'
when 3 then 'Distribution'
when 4 then 'Merge'
when 9 then 'Queue Reader'
end as AgentType,
case status
when 1 then 'Started'
when 2 then 'Succeeded'
when 3 then 'Progress'
when 4 then 'Idle'
when 5 then 'Retrying'
when 6 then 'Failed'
end as Status,
case warning
when 1 then 'expiration'
when 2 then 'latency'
when 4 then 'mergeexpiration'
when 16 then 'mergeslowrunduration'
when 32 then 'mergefastrunspeed'
when 64 then 'mergeslowrunspeed'
end as Warning,
last_distsync, retention, avg_latency, average_runspeedPerf
from distribution.dbo.MSreplication_monitordata
end
SELECT
@TableHTML = @TableHTML +
'<p style="margin-top: 1; margin-bottom: 0"> </p>
<font face="Verdana" size="4">Replication Statistics</font>
<table style="BORDER-COLLAPSE: collapse" borderColor="#111111" cellPadding="0" width="75%" bgColor="#ffffff" borderColorLight="#000000" border="1">
<tr>
<th align="left" bgColor="#000080">
<font face="Verdana" size="1" color="#FFFFFF">AgentName</font></th>
<th align="left" bgColor="#000080">
<font face="Verdana" size="1" color="#FFFFFF">PublicationType</font></th>
<th align="left" bgColor="#000080">
<font face="Verdana" size="1" color="#FFFFFF">AgentType</font></th>
<th align="left" bgColor="#000080">
<font face="Verdana" size="1" color="#FFFFFF">Status</font></th>
<th align="left" bgColor="#000080">
<font face="Verdana" size="1" color="#FFFFFF">Warning</font></th>
<th align="left" bgColor="#000080">
<font face="Verdana" size="1" color="#FFFFFF">Last_Dist_Sync</font></th>
<th align="left" bgColor="#000080">
<font face="Verdana" size="1" color="#FFFFFF">Retention</font></th>
<th align="left" bgColor="#000080">
<font face="Verdana" size="1" color="#FFFFFF">avg_latency</font></th>
<th align="left" bgColor="#000080">
<font face="Verdana" size="1" color="#FFFFFF">average_runspeedPerf</font></th>
</tr>'
SELECT
@TableHTML = @TableHTML +
'<tr>' +
'<td><font face="Verdana" size="1">' + isnull(cast(agent_name as varchar(100)),'') +'</font></td>' +
'<td><font face="Verdana" size="1">' + isnull(cast(PublicationType as varchar(100)),'') +'</font></td>' +
'<td><font face="Verdana" size="1">' + isnull(cast(AgentType as varchar(500)),'') +'</font></td>' +
'<td><font face="Verdana" size="1">' + isnull(cast([Status] as varchar(50)),'') +'</font></td>' +
'<td><font face="Verdana" size="1">' + isnull(cast([Warning] as varchar(200)),'') +'</font></td>' +
'<td><font face="Verdana" size="1">' + isnull(cast(last_distsync as varchar(100)),'') +'</font></td>' +
'<td><font face="Verdana" size="1">' + isnull(cast([retention] as varchar(100)),'') +'</font></td>' +
'<td><font face="Verdana" size="1">' + isnull(cast(avg_latency as varchar(100)),'') +'</font></td>' +
'<td><font face="Verdana" size="1">' + isnull(cast(average_runspeedPerf as varchar(100)),'') +'</font></td>' +
'</tr>'
FROM #replication_status
SELECT
@TableHTML = @TableHTML + N'</table>'
end
else
begin
SELECT
@TableHTML = @TableHTML +
'<br><p><font face="Verdana" size="4">Replication Status</font> (Replication not configured / No publications)</p>'
end
--============replication status ends
-----------------------------
-- ======== DB Log Shipping Monitor
if exists (select * from msdb..log_shipping_monitor_primary)
begin
SELECT
@TableHTML = @TableHTML +
'<p style="margin-top: 1; margin-bottom: 0"> </p>
<font face="Verdana" size="4">Log Shipping Stats</font><br />
<font face="Verdana" size="2">Local Primaries</font>
<table style="BORDER-COLLAPSE: collapse" borderColor="#111111" width="75%" cellPadding="0" bgColor="#ffffff" borderColorLight="#000000" border="1">
<tr>
<th align="left" bgColor="#000080">
<font face="Verdana" size="1" color="#FFFFFF">Instance</font></th>
<th align="left" bgColor="#000080">
<font face="Verdana" size="1" color="#FFFFFF">Database</font></th>
<th align="left" bgColor="#000080">
<font face="Verdana" size="1" color="#FFFFFF">BackupThreshold</font></th>
<th align="left" bgColor="#000080">
<font face="Verdana" size="1" color="#FFFFFF">LastBackup</font></th>
<th align="left" bgColor="#000080">
<font face="Verdana" size="1" color="#FFFFFF">LastBackupFile</font></th>
</tr>'
SELECT
@TableHTML = @TableHTML +
'<tr>' +
'<td><font face="Verdana" size="1">' + isnull(cast(primary_server as varchar(100)),'') +'</font></td>' +
'<td><font face="Verdana" size="1">' + isnull(cast(primary_database as varchar(100)),'') +'</font></td>' +
'<td><font face="Verdana" size="1">' + isnull(cast(backup_threshold as varchar(10)),'') +'</font></td>' +
'<td><font face="Verdana" size="1">' + isnull(cast(last_backup_date as varchar(50)),'') +'</font></td>' +
'<td><font face="Verdana" size="1">' + isnull(cast(last_backup_file as varchar(300)),'') +'</font></td>' +
'</tr>'
FROM msdb..log_shipping_monitor_primary
SELECT
@TableHTML = @TableHTML + N'</table>'
end
if exists (select * from msdb..log_shipping_monitor_secondary)
begin
SELECT
@TableHTML = @TableHTML +
'<p style="margin-top: 1; margin-bottom: 0"> </p>
<font face="Verdana" size="2">Local Secondaries</font>
<table style="BORDER-COLLAPSE: collapse" borderColor="#111111" width="75%" cellPadding="0" bgColor="#ffffff" borderColorLight="#000000" border="1">
<tr>
<th align="left" bgColor="#000080">
<font face="Verdana" size="1" color="#FFFFFF">PrimaryInstance</font></th>
<th align="left" bgColor="#000080">
<font face="Verdana" size="1" color="#FFFFFF">SecondaryInstance</font></th>
<th align="left" bgColor="#000080">
<font face="Verdana" size="1" color="#FFFFFF">Database</font></th>
<th align="left" bgColor="#000080">
<font face="Verdana" size="1" color="#FFFFFF">RestoreThreshold</font></th>
<th align="left" bgColor="#000080">
<font face="Verdana" size="1" color="#FFFFFF">LastRestore</font></th>
<th align="left" bgColor="#000080">
<font face="Verdana" size="1" color="#FFFFFF">LastRestoredFile</font></th>
</tr>'
SELECT
@TableHTML = @TableHTML +
'<tr>' +
'<td><font face="Verdana" size="1">' + isnull(cast(primary_server as varchar(100)),'') +'</font></td>' +
'<td><font face="Verdana" size="1">' + isnull(cast(secondary_server as varchar(100)),'') +'</font></td>' +
'<td><font face="Verdana" size="1">' + isnull(cast(primary_database as varchar(100)),'') +'</font></td>' +
'<td><font face="Verdana" size="1">' + isnull(cast(restore_threshold as varchar(10)),'') +'</font></td>' +
'<td><font face="Verdana" size="1">' + isnull(cast(last_restored_date as varchar(50)),'') +'</font></td>' +
'<td><font face="Verdana" size="1">' + isnull(cast(last_restored_file as varchar(300)),'') +'</font></td>' +
'</tr>'
FROM msdb..log_shipping_monitor_secondary
SELECT
@TableHTML = @TableHTML + N'</table>'
end
-- Fetch from remote secondaries
if exists (select * from msdb..log_shipping_primary_secondaries)
begin
declare @remotesecondary sysname;
if exists (select name from tempdb..sysobjects where name like '%#remoteLSSecondaries%')
drop table #remoteLSSecondaries
select secondary_server into #remoteLSSecondaries from msdb..log_shipping_primary_secondaries
select top 1 @remotesecondary = secondary_server from #remoteLSSecondaries
while(@remotesecondary is not null)
begin
set @cmd = 'select primary_server, secondary_server,
secondary_database, restore_threshold,
last_restored_date, last_restored_file
FROM OPENROWSET(''SQLNCLI'', ''Server=' + @remotesecondary+';Trusted_Connection=yes;'',
''select * from msdb..log_shipping_monitor_secondary'') AS a'
if exists (select name from tempdb..sysobjects where name like '%#remoteLSStats%')
drop table #remoteLSStats
create table #remoteLSStats
(
primary_server sysname, secondary_server sysname,
secondary_database sysname, restore_threshold int,
last_restored_date varchar(50), last_restored_file varchar(500)
)
insert into #remoteLSStats
exec (@cmd)
delete from #remoteLSSecondaries where secondary_server = @remotesecondary
set @remotesecondary = NULL
select top 1 @remotesecondary = secondary_server from #remoteLSSecondaries
end
--select * from #remoteLSStats
SELECT
@TableHTML = @TableHTML +
'<p style="margin-top: 1; margin-bottom: 0"> </p>
<font face="Verdana" size="2">Remote Secondaries</font>
<table style="BORDER-COLLAPSE: collapse" borderColor="#111111" width="75%" cellPadding="0" bgColor="#ffffff" borderColorLight="#000000" border="1">
<tr>
<th align="left" bgColor="#000080">
<font face="Verdana" size="1" color="#FFFFFF">PrimaryInstance</font></th>
<th align="left" bgColor="#000080">
<font face="Verdana" size="1" color="#FFFFFF">SecondaryInstance</font></th>
<th align="left" bgColor="#000080">
<font face="Verdana" size="1" color="#FFFFFF">Database</font></th>
<th align="left" bgColor="#000080">
<font face="Verdana" size="1" color="#FFFFFF">RestoreThreshold</font></th>
<th align="left" bgColor="#000080">
<font face="Verdana" size="1" color="#FFFFFF">LastRestore</font></th>
<th align="left" bgColor="#000080">
<font face="Verdana" size="1" color="#FFFFFF">LastRestoredFile</font></th>
</tr>'
SELECT
@TableHTML = @TableHTML +
'<tr>' +
'<td><font face="Verdana" size="1">' + isnull(cast(primary_server as varchar(100)),'') +'</font></td>' +
'<td><font face="Verdana" size="1">' + isnull(cast(secondary_server as varchar(100)),'') +'</font></td>' +
'<td><font face="Verdana" size="1">' + isnull(cast(secondary_database as varchar(100)),'') +'</font></td>' +
'<td><font face="Verdana" size="1">' + isnull(cast(restore_threshold as varchar(10)),'') +'</font></td>' +
'<td><font face="Verdana" size="1">' + isnull(cast(last_restored_date as varchar(50)),'') +'</font></td>' +
'<td><font face="Verdana" size="1">' + isnull(cast(last_restored_file as varchar(300)),'') +'</font></td>' +
'</tr>'
FROM #remoteLSStats
SELECT
@TableHTML = @TableHTML + N'</table>'
end
-- ========== DB Log shipping monitor ends
SELECT
@TableHTML = @TableHTML +
'<p style="margin-top: 0; margin-bottom: 0"> </p>
<hr color="#000000" size="1">
<!--<p><font face="Verdana" size="2"><b>Server Owner:</b> '+@owner+'</font></p> -->
<p style="margin-top: 0; margin-bottom: 0"><font face="Verdana" size="2">Thanks
and Regards,</font></p>
<p style="margin-top: 0; margin-bottom: 0"><font face="Verdana" size="2">DB
Support Team</font></p>
<p> </p>'
EXEC msdb.dbo.sp_send_dbmail
@profile_name = @MailProfile,
@recipients=@Recepients,
@subject = @strSubject,
@body = @TableHTML,
@body_format = 'HTML' ;
--print @TableHTML
SET NOCOUNT OFF
Understanding Database Backup Encryption in SQL Server
Prerequisites
- SQL Server 2014+ Enterprise or Standard Edition
- Write access to a local/remote file system
- Storage with adequate space to create a backup of the database
Benefits
- Encryption for native SQL Managed Backup
- Security and integrity of the backup
- It can also be used for databases that are encrypted using TDE
- Additional security for off-site backups
- Use of various encryption algorithms, which provides you with flexibility in selecting an algorithm that aligns with your requirements
- Use of asymmetric key to manage and integrate security with EKM providers
Feature Support – SQL [2014-2016]
| Feature | Enterprise | Standard | Web | Express with Advanced Services | Express |
| Encrypted backup | Yes | Yes | No | No | No |
Database Backup with Encryption
Almost every organization has a challenge of protecting the data. It is almost impossible to run a business without protecting the sensitive data. This feature comes handy where backups are managed and handled at a remote site or cloud. In order to encrypt the backup, we will need a certificate. And, in order to create a certificate, we will need a master key for the database.
Demonstration
Let’s see how we can create a secure backup for off-site storage. We’ll do that by creating a new database. Let’s call it “SQLHub”. I’m going to switch into the SQLHub database to create a sample table to hold dummy data which are needed to demonstrate the Tail Log backup process. A stored procedure is created to generate the sample data. On execution of the stored procedure, the data will be fed to the table.
|
— create a new database for this example
CREATE DATABASE SQLHub;
GO
USE SQLHub;
GO
— insert some data
CREATE TABLE SQLHubTable (
ID int IDENTITY(1,1000) PRIMARY KEY NOT NULL,
value int
);
GO
CREATE PROCEDURE InsertSQLHubTable
AS
DECLARE @i int = 1
WHILE @i <100
BEGIN
INSERT SQLHubTable (value) VALUES (@i)
Set @i +=1
END
GO
EXECUTE InsertSQLHubTable;
GO
SELECT * FROM SQLHubTable;
GO
|

Generate Master Key
Now, I’ll change the current context of the database to Master. Next, we’re going to create a master key and the certificate on our server.
|
USE MASTER;
GO
— create master key and certificate
CREATE MASTER KEY ENCRYPTION BY PASSWORD = ‘!@Api1401@2015!!’;
GO
|
Create Certificate
The certificate “SQLHubDBCert” will be created with a subject line, which’ll just appear in the metadata for the certificate, of SQLHubDBCert Backup Certificate. I’ll execute the below line to create the certificate.
Now, since we’re working in the master database, I can find that certificate created in the System database. Browsing the Object Explorer, expanding master, going down to Security, and then opening up the Certificates folder tells that the certificate is created.
In order protect the data from failure event; make sure that back-up the certificate to an external file. Let’s backup the certificate using the BACKUP CERTIFICATE command, the name of the certificate is SQLHubDBCert, and we’ll export it to a file to remote secured location
|
CREATE CERTIFICATE SQLHubDBCert
WITH SUBJECT = ‘SQLHubDB Backup Certificate’;
GO
|
The name of the certificate file is “f:\Program Files\SQLHubDBCert.cert”. We’d also want to export the private key file, “f:\Program Files\SQLHubDBCert.key” which will encrypt the certificate file. Finally, we’ll protect the entire thing with a strong password. Let’s create the backup of the certificate at a secured offsite location
|
— export the backup certificate to a file
BACKUP CERTIFICATE SQLHubDBCert TO FILE = ‘f:\Program Files\SQLHubDBCert.cert’
WITH PRIVATE KEY (
FILE = ‘f:\Program Files\SQLHubDBCert.key’,
ENCRYPTION BY PASSWORD = ‘Api1401@2015!!’)
|

If you get an error message at this point stating that your password doesn’t meet Windows’ policy requirements, it simply means that your installation of Windows is configured to require stronger passwords. Make sure you enter a strong password.
Database Backup
Next, I’m going to back-up the SQLHub database with the encryption protocols enabled. The AES_256 encryption is a very strong and a recommended encryption algorithm. We’re going to encrypt this backup with the server certificate that we just created.
|
— backup the database with encryption
BACKUP DATABASE SQLHub
TO DISK = ‘g:\Program Files\SQLHub.bak’
WITH ENCRYPTION (ALGORITHM = AES_256, SERVER CERTIFICATE = SQLHubDBCert)
|

Database Recovery
This section discusses the demonstration of the Tail Log backup using database encryption. The data is inserted after a full backup of SQLHub. We’re going to drop the database SQLHub, and the certificate file, just to simulate movement to a new, clean instance of SQL Server.
|
— insert additional records
USE SQLHub;
GO
EXECUTE InsertSQLHubTable;
|
Let’s demonstrate the recovery process.
- Insert sample data
- Simulate database corruption by detaching the database
- Delete the file from the drive
- Bring the database back online
- Refresh the database
- Initiate the Tail Log backup with database encryption
|
— take SQLHub offline
ALTER DATABASE SQLHub SET OFFLINE WITH ROLLBACK IMMEDIATE
— delete .mdf data file from the hard drive
|


|
— attempt to take TailLogDB online
USE master;
GO
BACKUP LOG SQLHub
TO DISK = ‘g:\Program Files\SQLHubTailLogDB.log’
WITH CONTINUE_AFTER_ERROR,ENCRYPTION (ALGORITHM = AES_256, SERVER CERTIFICATE = SQLHubDBCert)
|

Check the backup meta-data
If you use encryption during the backup you wouldn’t be able to append the backup to an existing media set. The restoration just works like normal restoration steps, except ensuring the corresponding certificates are created and configured on the destination server.
|
—Check for the backup
SELECT
b.database_name,
key_algorithm,
encryptor_thumbprint,
encryptor_type,
b.media_set_id,
is_encrypted,
type,
is_compressed,
bf.physical_device_name
FROM msdb.dbo.backupset b
INNER JOIN msdb.dbo.backupmediaset m ON b.media_set_id = m.media_set_id
INNER JOIN msdb.dbo.backupmediafamily bf on bf.media_set_id=b.media_set_id
WHERE database_name = ‘SQLHub’
ORDER BY b.backup_start_date DESC
|

We have four new files that have just been created. We have the backup certificate, the encryption key file, as well as the full backup and the tail log backup of our database. Let’s go back into SQL Server Management Studio and see how we can restore this backup.
|
— clean up the instance
DROP DATABASE SQLHub;
GO
DROP CERTIFICATE SQLHubDBCert;
GO
DROP MASTER KEY;
GO
|
After running the commands above, if I right-click on the Security folder and say Refresh, you’ll notice that it is no longer inside of our Certificates folder. And, if I go back up and refresh databases, you’ll notice that SQLHub is no longer available either. Now, let’s attempt to restore the database from the backup. I’ll specify that I want to restore the database, SQLHub, from the disk. When I execute the command, I get an error message, saying that it couldn’t find the server certificate required in order to restore the backed-up database.
Without configuring the certificate, any attempt to restore would result in the following error:
|
—Use RESTORE FILELISTONLY to get the logical names of the data files in the backup. This is especially useful when you’re working with an unfamiliar backup file.
RESTORE FILELISTONLY FROM DISK=‘g:\Program Files\SQLHub.bak’
|

Recreate the master key and the certificates
In order to restore this encrypted database, we first need to restore the certificate. But this time, instead of creating it based off of the master key for the database, we’re going to restore it from the file. I’ll specify FROM FILE and the path to that file that we exported. We’ll also specify the private key file. Finally, we’ll enter DECRYPTION BY PASSWORD and we’ll re-specify the password that we established earlier when we created that key. After execution, if I go back into System Databases -> master, -> Security, and back to Certificates, we should see the SQLHubDBCert certificate back there.
|
— recreate master key and certificate
CREATE MASTER KEY ENCRYPTION BY PASSWORD = ‘!@Api1401@2015!!’;
GO
— restore the certificate
CREATE CERTIFICATE SQLHubDBCert
FROM FILE = ‘f:\Program Files\SQLHubDBCert.cert’
WITH PRIVATE KEY (FILE = ‘f:\Program Files\SQLHubDBCert.key’,
DECRYPTION BY PASSWORD = ‘Api1401@2015!!’);
GO
|

Database Restoration
Now, go ahead and try the restore again, the RESTORE DATABASE SQLHub from the disk file. Execute the command, and voila, it processed successfully this time! We see that the database, SQLHub, came online
|
—Use RESTORE WITH MOVE to move and/or rename database files to a new path.
RESTORE DATABASE SQLHub FROM DISK = ‘g:\Program Files\SQLHub.bak’
WITH NORECOVERY,
MOVE ‘SQLHub’ TO ‘f:\Program Files\Microsoft SQL Server\MSSQL13.MSSQLSERVER\MSSQL\DATA\SQLHub_Data.mdf’,
MOVE ‘SQLHub_Log’ TO ‘g:\Program Files\Microsoft SQL Server\MSSQL13.MSSQLSERVER\MSSQL\DATA\SQLHub_Log.ldf’,
REPLACE, STATS = 10;
GO
— attempt the restore log again
RESTORE LOG SQLHub
FROM DISK = ‘g:\Program Files\SQLHubTailLogDB.log’;
GO
|

|
—Data validation
SELECT * FROM SQLHubTable;
GO
— clean up the instance
DROP DATABASE SQLHub;
GO
DROP CERTIFICATE SQLHubDBCert;
GO
DROP MASTER KEY;
GO
|

Database backup Using Asymmetric Key
In order to encrypt the database encryption key with an asymmetric key, please use an asymmetric key that resides on an Extensible Key Management Provider. Extensible Key Management (EKM) is another new feature that gives SQL Server the ability to store the encryption key used for TDE on hardware specifically designed for key security and management. Such devices are called High Security Modules (HSM), whose vendors are referred to as EKM providers. A good key management vendor should supply you with software libraries that easily add and implement it in SQL Server encryption.
SQL Server stores encryption keys separately from the database server on a secure key manager, in order to meet various compliance requirements. Encryption is supported for backups done by SQL Server Managed Backup, which provides additional security for off-site backups. For example, a database backup file placed on the cloud.
In asymmetric encryption, two different keys are used: A “public key” for encrypting and a “private key” for decrypting. This type of asymmetric encryption is referred to as Public Key Infrastructure (PKI) or Public-key Cryptography.
Summary
- In an environment that relies on SQL-managed native backup methodology, this would be a great feature to secure the data. Given that the backup files are encrypted, we can be confident that they’ll be unusable even if they fall into the wrong hands, while still taking advantage of an off-site storage strategy.
- While the process of recovery is no different from restoring the normal database backup file, there’s no “backdoor” to recover the database access if you lose all access to the keys. So keep the keys safe.
- The restore operation validates the thumbprint of the certificate during the restore operation. Therefore, the certificate used to create the backup must be retained in its original state.
- If restoring a database from an encrypted backup file is performed on the same SQL Server instance, the restore operation is performed as usual, since the keys and the certificate are already contained in the master database. They’d be opened automatically during the process of decryption
- You won’t be able to append the backup files to the existing media set in case of encrypted backups; this is not the case with normal backup methodology.
- Even after several attempts, I didn’t notice a significant difference in the usage of system resources during the process of encryption of database backup, when compared to the normal database backup operation. However, AES is a block cipher, and requires the input to be a multiple of the block size (16 bytes, a.k.a. 128 bits). This means that padding schemes are used. Most of the time, the padding is negligible, which may be a reason why it doesn’t increase the size of the backup.
- Use a combination of hardware- and software-supporting AES with a 256-bit key to ensure that the encryption doesn’t impact your backup or recovery time objectives.
Best Practices for Configuring Newly Installed SQL Server Instances
Often we install SQL Server on clients or we get to clients where they have pre-installed SQL Server Instances. As a DBA we have the Primary responsibility of keeping the Database Up and Running. This responsibility leads to optimizing, performance tuning and many other stuff related to database’s internal objects. While keeping the other aspects in mind many of us have to go through the configuration of the newly installed or pre-installed but un-configured instances. Configuring SQL Server newly instances are not an easy task and a DBA might want to configure an Instance in many ways.
Here, I am going to discuss some basic and most important configurations of the SQL Server Instance and Database Level which might be ignored and can cause performance issues. Although this is not the complete list of configurations as that would be too long and it’s not a good idea to discuss all the settings under a single article but some of them are basic and critical for initial setup.
Mentioned below are the items discussed one by one which we should configure according to the organization’s or client’s requirement on a new instance.
1. SQL Server Maximum Memory Setting:
By default, SQL Server is allowed to use up to 2 Peta Byte maximum SQL Server Memory. As we all know, normally, we do not have this much of memory in the SQL Server Box so we need to keep this amount much lower than the default. So it would be good to keep 20% or 20 GB (whichever is lower) for the operating system and give rest of the amount to SQL Server by specifying that particular amount in MBs in the Maximum Server Memory option shown below:
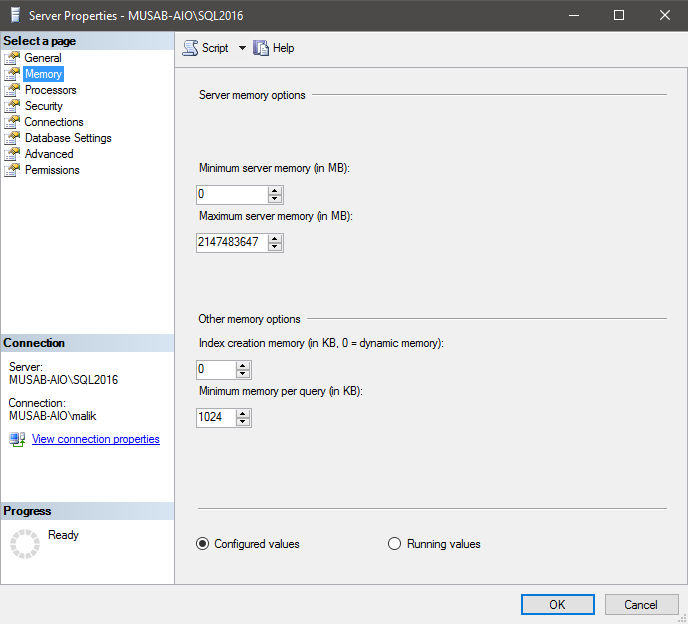
2. Database Default Locations:
Ideally speaking we should configure the instance to have separate locations for Data, Log and Backup files. These default locations on instance will be used to auto fill the default location for creating new databases. Before assigning the locations make sure you have allocated enough space for the new databases and mention the default values for each option i.e. Data Files, Log Files and Backup Files as shown below:
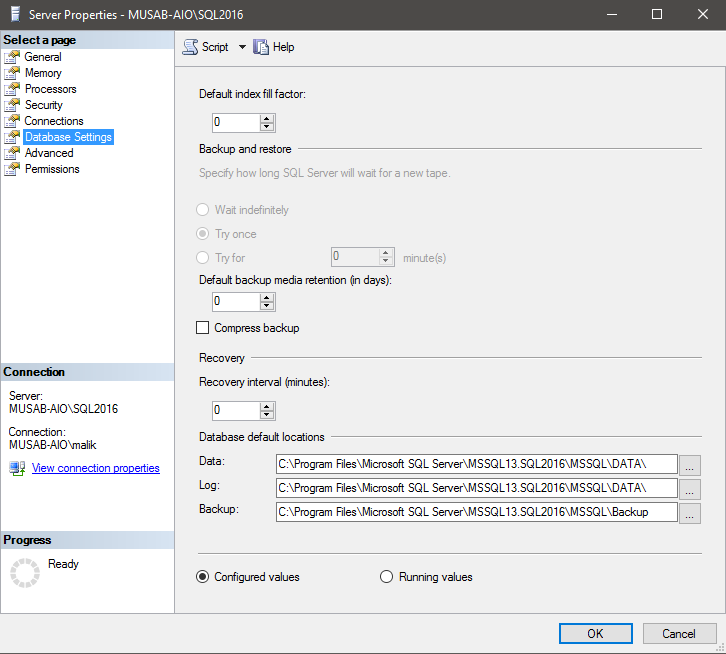
3. Maximum Degree of Parallelism:
It’s one of the critical settings to be configured and setup. To oversimplify things, I would suggest to use the 8 as a thumb rule number. Just keep a simple formula in your mind that if you have 8 or more Logical Processor in one NUMA Node (Physical Processor) then use 8 as the MAXDOP settings number. If you have less than 8 Logical Processor in one NUMA Node, then use that number instead.
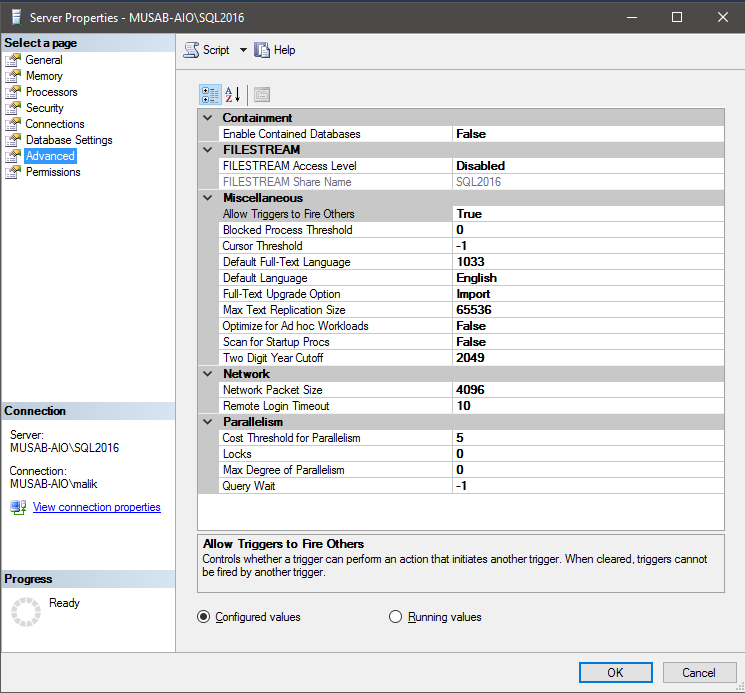
4. TempDB File growth and location settings:
TempDB File growths are by default set in percentage, unlimited and created at C Drive and have only 1 Data file. This configuration is not appropriate though in newer versions of SQL Server 2016 or higher we have better defaults but not all the organizations use the latest version. So, first the TempDB should be on a separate drive preferably on an SSD with at least 4 files. The file growth has many views but I would prefer to go with extending the initial size of the TempDB file to be maximum possible like if you have 10 GB drive for TempDB then the Data files should be around 2 GB each for data file and 2 GB for log file. Here I want to be clear that I am not giving an equal amount of file size to data and log. The data files should all be equally sizes but log file can be different depending upon your needs.
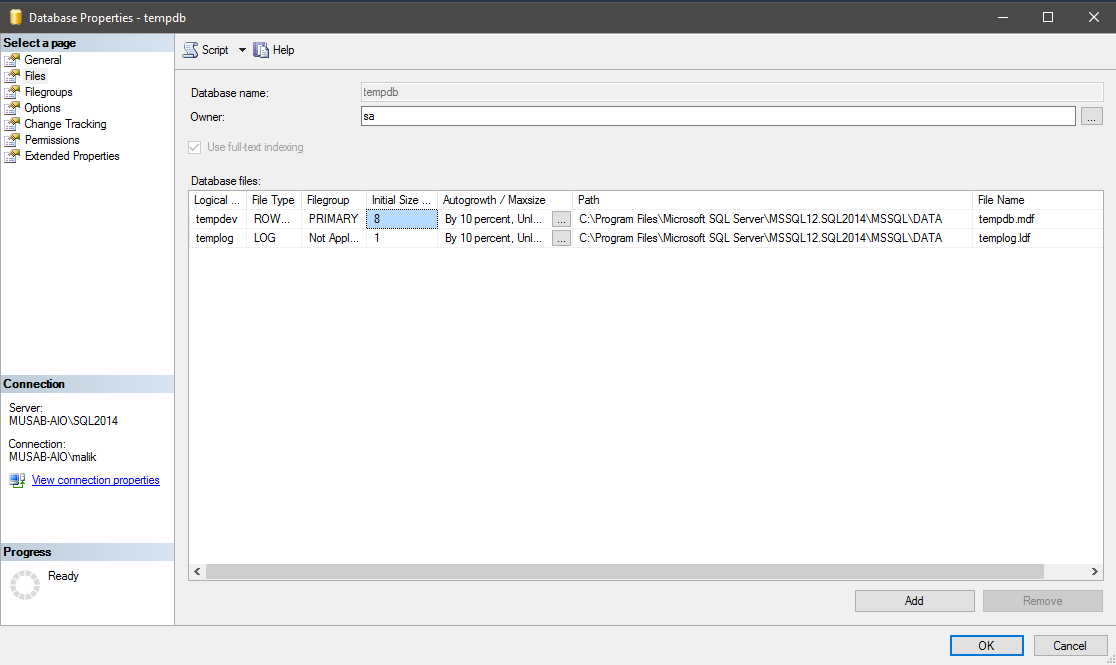
5. Service Accounts
The Service Account by default are NTService and this should be changed to a dedicated SQL Server Domain account which should have file and system level access. The Services like SQL Server Instance and SQL Server Agent should be separately handled. Keep in mind that changing the SQL Server Service account needs a Service Restart so change the SQL Server Service Accounts when the SQL Server is not deployed to production or if it’s already in production then do plan ahead the downtime. The downtime should not exceed couple of minutes but to be on the safer side get a 10-minute downtime if possible.
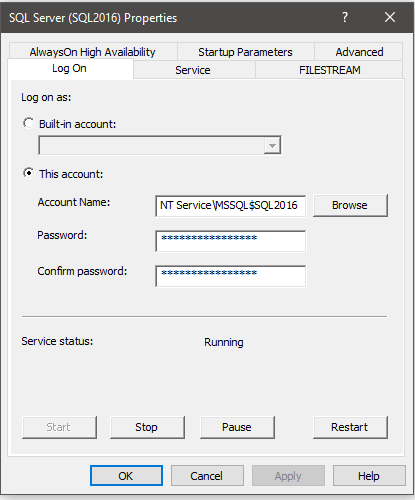
6. SQL Server Port
SQL Server uses the default port of 1433 which is widely known and most often DBAs don’t change it. This is again a bad practice to use the defaults. Although one can argue that the SQL Server Boxes are secured by firewalls and antiviruses and all that fancy stuff but still it would be good to change the default port to someone else and get an additional security.
You can change the port in the TCP/IP settings under the SQL Server Network Configuration settings by opening up the SQL Server Configuration Manager.
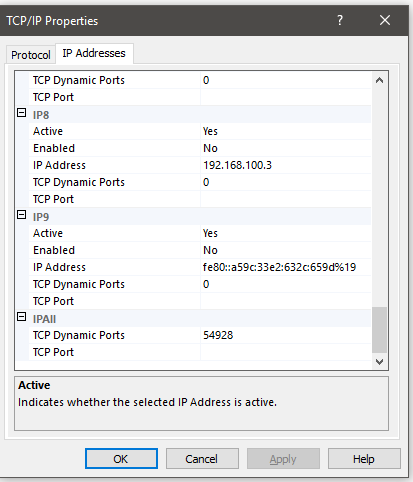
7. SQL Server Model Database Settings:
As you have set the default database file locations at instance level, now you also need to set the default settings for any new database you create. There are a lot of settings which can be tweaked here but some of them are critical which will benefit you in the longer term.
You can set the initial size of the Model database to be 10 GB, Auto Growth to be 1 GB instead of percentage (Prior to SQL Server 2016) or 64MB (SQL Server 2016) which causes problem like extended growths and high volume of VLFs.
In Addition to the above mentioned settings you can also make the database level settings like Read Committed Snapshot Isolation Level and some of the newly introduced settings at database level (my personal favorites) like MAXDOP and Legacy Cardinality Estimator Options.
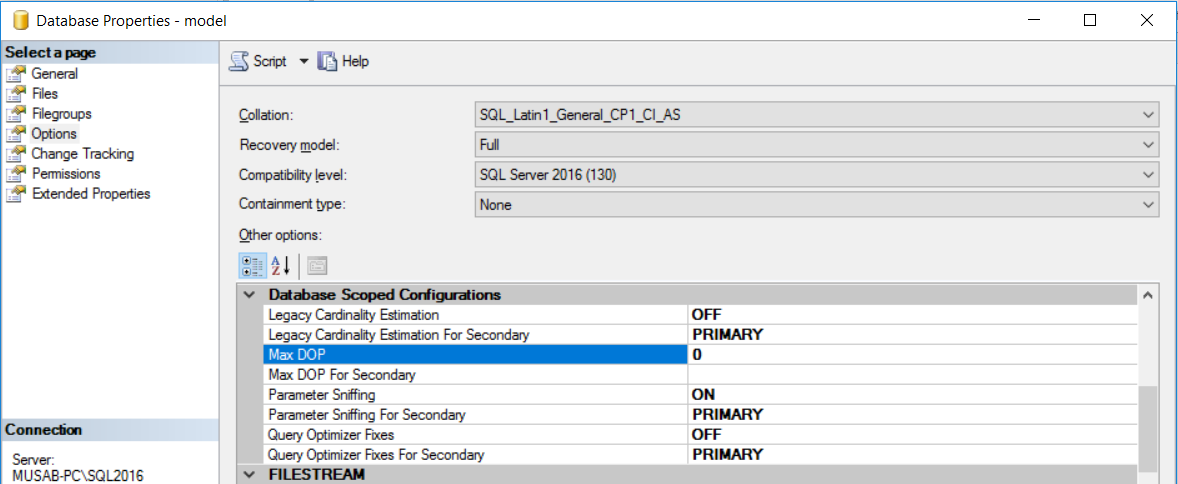
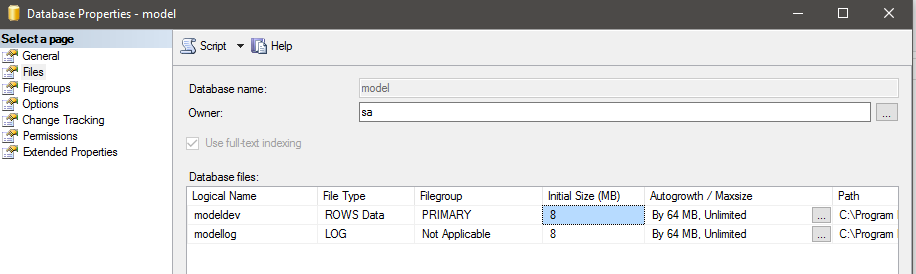
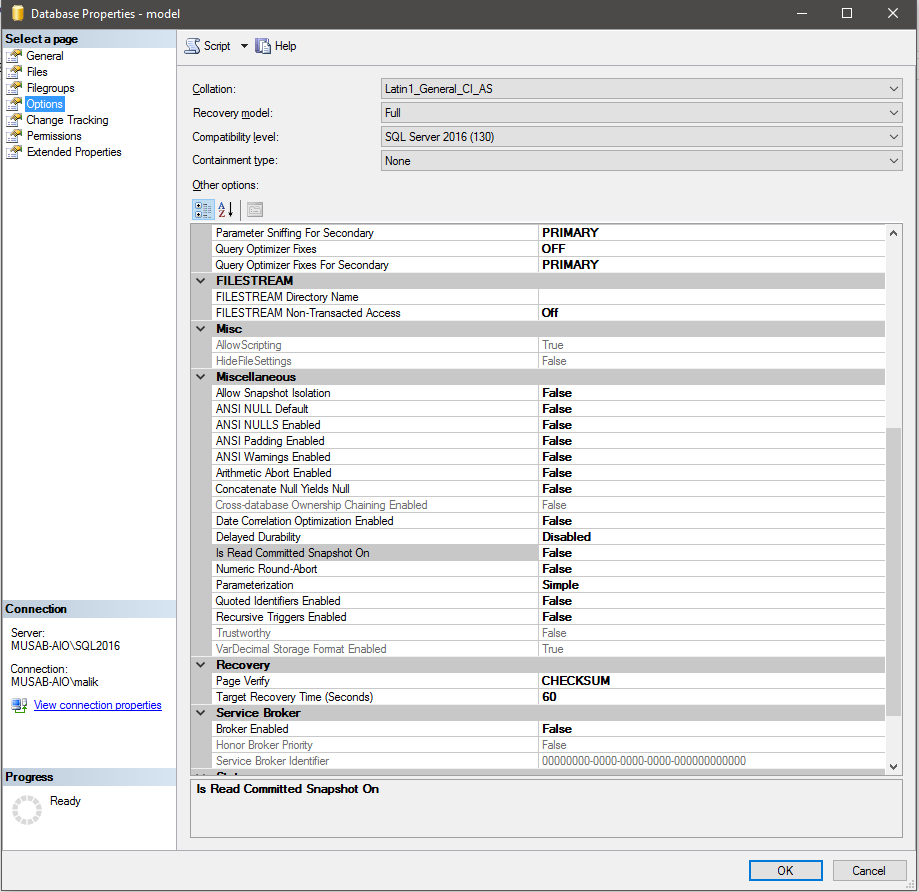
8. Registered Servers and Multi-Server Query:
There is a very rare chance in a life of a Senior DBA that he/she gets a job in which only single instance is to be managed. If that is the case, you are blessed . But this is not the case with me. So, I have to deal with 20,30 or even 100s of instances at different clients. So, connecting, executing queries and deploying scripts on multiple instances if really a painful task. The solution is to use the Registered Servers and query your instances using Multi-Server Query option.
First you need to create group based on your requirements like Development, Staging and Production as shown below. This option is available under View tab.
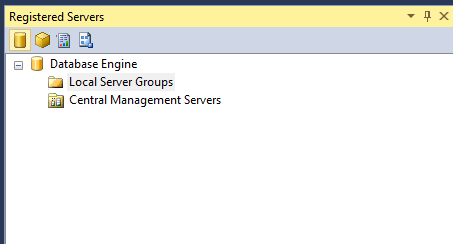
Right Click on the Local Server Groups and add appropriate Groups as shown below:
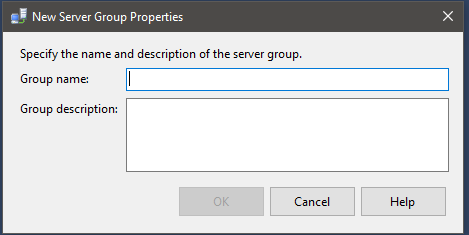
Then Right Click on the newly created group and add your Servers one by one as shown in the pictures below:
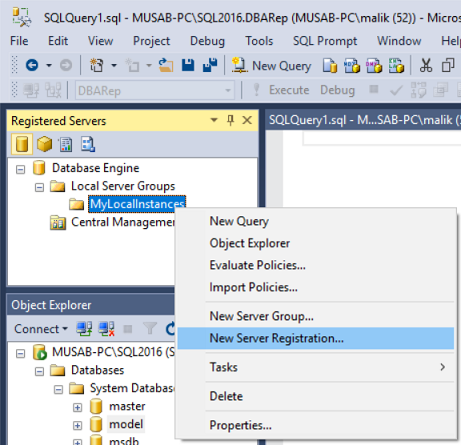
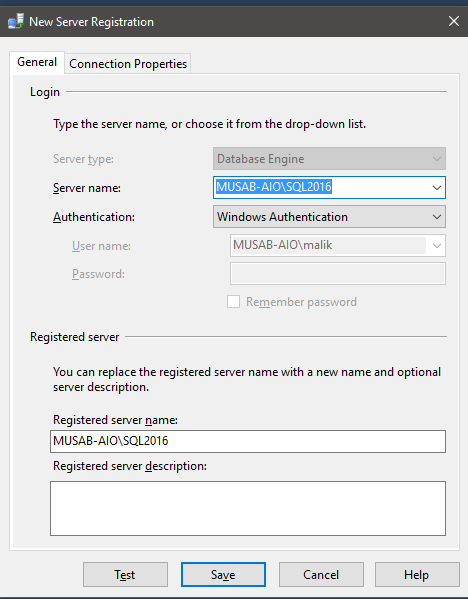
Finally, the multi-Server query is here. It’s really very simple and effective. Once you have registered your desired instances under one group. You simply right click on that particular group and click on the New Query option. Then a new query window will open as normal query window with one exception and that would be the Pink Bar in the connection status. That will give you the total servers and the connected servers count. For example, if you have 3 Servers and one of those is not available it will show you 2/3 meaning 2 servers are connected out of 3 total instances. So, if you have all the desired instances connected then you can issue any query which will be executed of all the instances and will give you results.
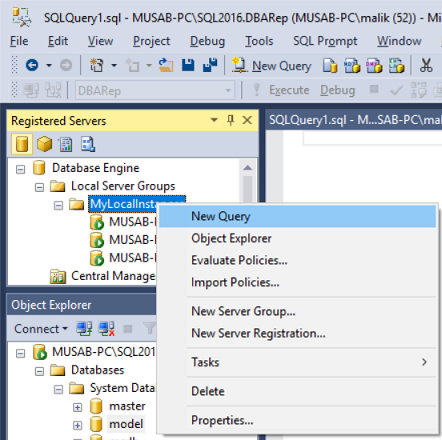
So, now you have a handful of settings which you can configure beforehand and it will be a long term benefit for you and your organization. Though, you don’t get limited to these configurations only but most common are listed here. We always have special scenarios where we need customized solutions and that is why experienced DBAs are hired so we can always tweak these and other settings ahead.
